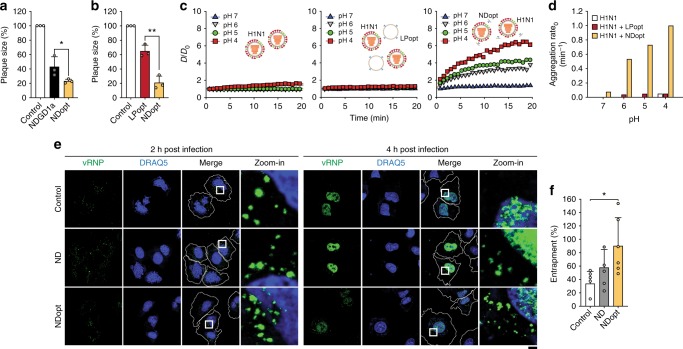
Fig. 4.
Abortive vRNP release in the endolysosome by NDopt. a, b Antiviral activity against H1N1 virus of NDopt compared with NDGD1a (50 nM) (a) or liposomes with the same lipid composition as NDopt (LPopt) (12.5 μM lipid) (b) was examined by a plaque assay (n = 3). c, d Aggregation of NDopt-disrupted viruses was monitored by measuring the changes in the average size of samples as a function of time. c Time-dependent changes in the diameter of H1N1 virus only (left panel), mixture of H1N1 and LPopt (middle panel) and mixture of H1N1 and NDopt (right panel). H1N1 virus (1 × 10⁷ PFU/mL) was mixed with PBS, LPopt (2.5 μM for lipid) or 16.6 nM NDopt. Changes in the diameter were monitored using a Zetasizer (Nano ZS90, Malvern Instruments, Ltd., Worcestershire, UK) and expressed as D/D0, where D0 and D are the averaged diameters of samples before and after vhjpH adjustment, respectively. d Aggregation rate0, calculated from the slope of D/D0 at the beginning of the aggregation reaction, suggests that viral envelope is efficiently disrupted by nanodiscs. e Influenza virus vRNP entrapment in endosome by NDopt. White squares in merge panels are enlarged to show virus entrapment (green) near the nucleus (blue) (zoom-in). Cell membranes shown as white dashed lines. Scale bars, 10 μm. f Quantitation of viral entrapment, which was calculated by dividing the number of vRNP spots in the endosome at 4 h post-infection by the number of vRNP spots at 2 h post-infection (n = 5). Data are expressed as the mean ± SD. Asterisks indicate statistical significance determined by Student’s t-test (*P < 0.05; **P < 0.01; ***P < 0.001) (a, b, f)

