Fig. 3.
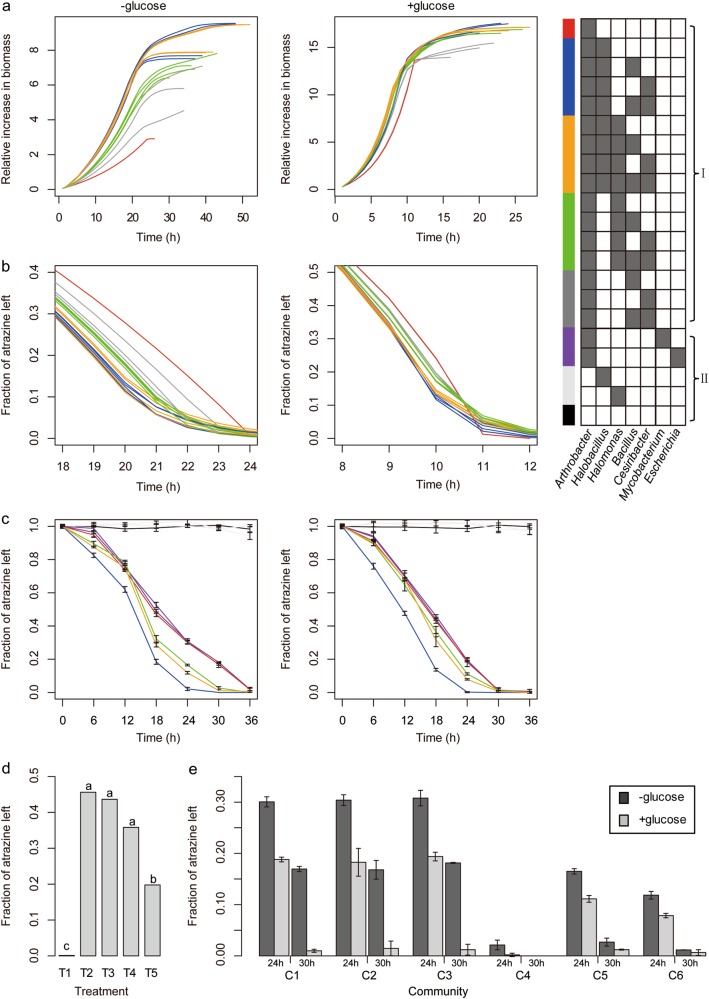
Simulations and experimental validations of atrazine degradation and bacterial growth performances. a–c Performances of bacterial combinations. Line colors are indicative of the combinations as indexed on the right grid (grey/white cells indicate species included/not included in the combination, respectively. I – 16 combinations formed by species represented by GSMM. All combinations include Arthrobacter aurescens TC1 (atrazine degrader) together with all possible combinations of the species modeled (chosen based on differential abundance). Red, A. aurescens TC1 only; Blue, combinations with Halobacillus sp. BAB-2008 but without Halomonas stevensii S18214; Orange, combinations with both H. sp. BAB-2008 and H. stevensii S18214; Green, combinations with H. stevensii S18214 but without H. sp. BAB-2008, Dark grey, combinations without H. sp. BAB-2008 or H. stevensii S18214. II, combinations used as control in the experimental validation. Purple, A. aurescens TC1 (atrazine degrader) with an exogenous strain (Escherichia coli) or an endogenous strains whose abundance was not affected by the application of atrazine (Mycobacterium sp. S8). Light grey—Halobacillus sp. NY15 and Halomonas sp. N8 without A. aurescens AT5 (atrazine degrader); Black—autoclaved strains. In both simulations (a, b) and in vitro experiments (c) performances were tested in two media: medium that contains atrazine as the sole carbon and nitrogen source (left) and medium with atrazine and glucose as carbon and nitrogen sources (right). a Predicted relative increase in biomass (1/h). The relative increase values indicate biomass(t)/biomass(0) -biomass(0). b Predicted atrazine degradation (mmol/gDW) due to degradation activity. c In vitro decrease in atrazine (mg/l). d Experimental validation of simulations by pot experiments following supplementing the soil with glucose. Fraction of atrazine left was estimated according to a bioassay (Supplementary Figure 1). T1, no atrazine; T2, atrazine only; T3, atrazine and 0.5% glucose; T4, atrazine and 1.0% glucose; T5, atrazine and 1.5% glucose. Different letters indicated statistically significant differences (P < 0.05) according to the Tukey test. e In vitro atrazine degradation in media with atrazine and supplemented/not supplemented with glucose (+glucose/-glucose, respectively). C1, AT5 only; C2, combinations of AT5 and S8; C3, combinations of AT5 and E. coli; C4, combinations of AT5 and NY15; C5, combinations of AT5 and N8; C6, combinations of AT5, NY15 and S8

