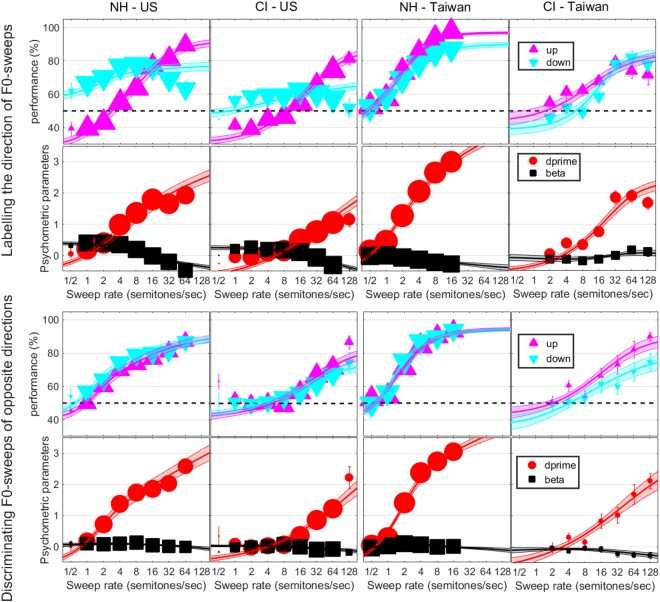
Figure 3.
Psychometric functions expressed as percent correct for up- and down-sweeps and subsequently converted into d′ values, in the 1I-2AFC labelling task (top) and the 3I-2AFC discrimination task (bottom), as a function of the rate of F0-sweeps expressed in semitones per second. Symbols represent the weighted mean and error bars indicate one weighted standard error of the mean. Note that the size of symbols relates to the weights on each condition reflecting the number of trials collected across all subjects. Lines and surfaces are the Weibull fits with one standard error.

