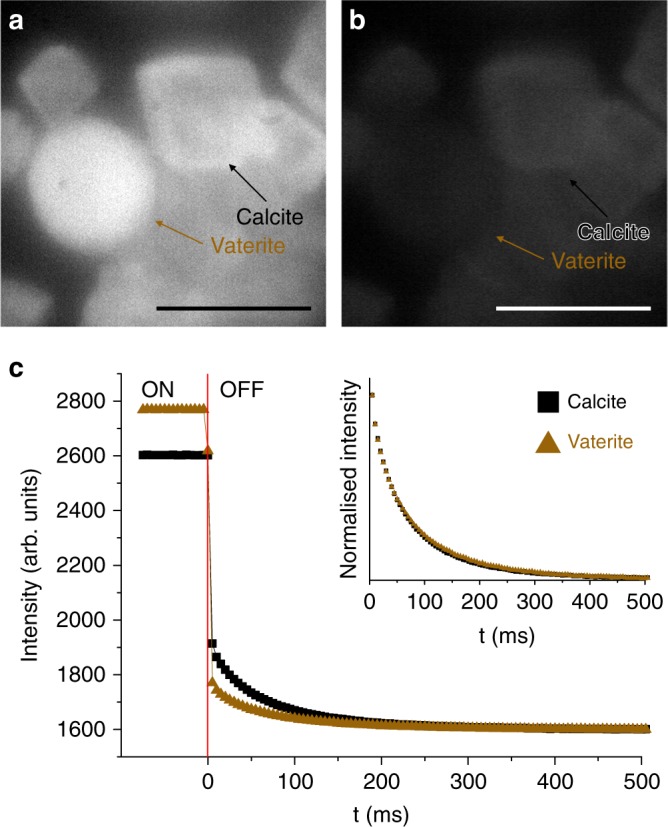
Fig. 6.

Dependence of room temperature phosphorescence activation on the crystal phase. Time-resolved phosphorescence microscopy images with UV excitation (a) on and (b) 5 ms after the removal of UV excitation, and (c) intensity vs time plots for calcite (black square) and vaterite (brown triangle)-based RTP nanocomposites. The plot in (c) shows the intensity with UV light on and off, and the point at which the light is removed is shown with a vertical red line at t = 0. The normalised decay curves for calcite and vaterite overlap, indicating identical phosphorescent lifetimes (inset; scale bar 50 μm)
