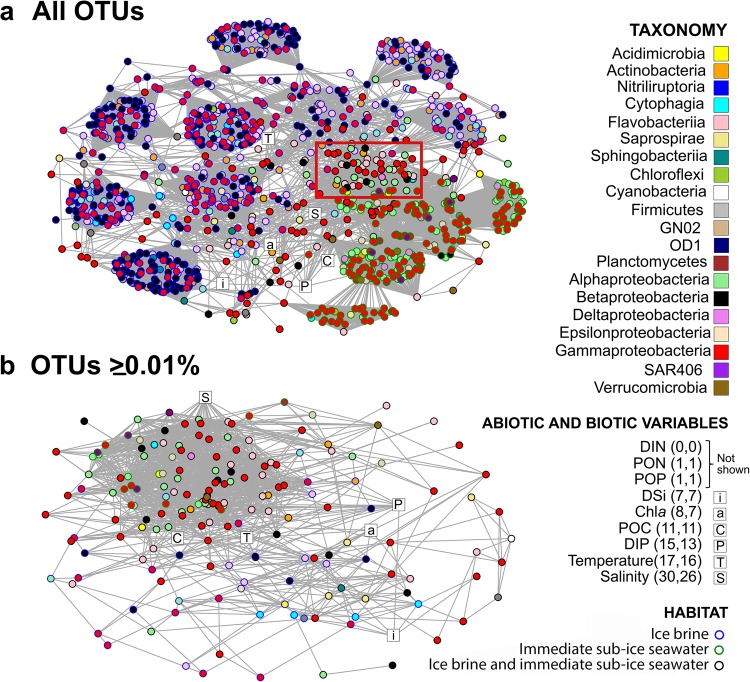
Fig. 5.
Network analysis of the sympagic metacommunity in the Central Arctic Ocean (CAO). a Network reconstructed by using all 2715 OTUs. b Network reconstructed by using only the 180 OTUs with relative abundance ≥ 0.01% across all samples. The red rectangle in a marks a module that mainly contains taxa that occurred in both ice brine (IB) and in the immediate sub-ice seawater (SW), most of which correspond to the abundant and widely distributed taxa in b. Vertices (circles) represent OTUs and edges (lines) represent non-random significant associations among OTUs. The colour of the circles denotes taxonomy and the circles around the circles denote habitat. White squares represent biotic and biotic variables; the numbers in brackets after the variables present the number of connections of the respective variable for networks a and b, respectively. DIN, PON and POP yielded no or only one connection and are not shown in the networks

