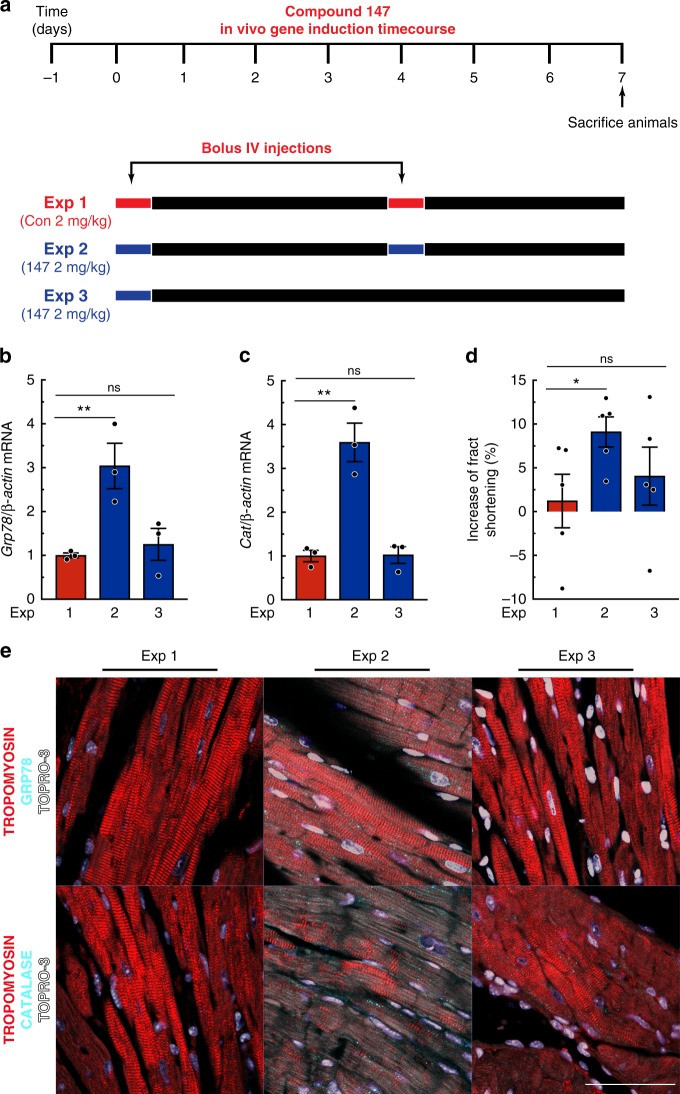
Fig. 6.
147 gene induction timecourse in vivo. a Experimental design testing the effects of 147 in WT untreated mice. Red bars depict the bolus administration of the control compound, while blue bars depict the bolus administration of 147. b, c qPCR for Grp78 (b) or Cat (c) in LV of mice from indicated experiments (n = 3). d Percent increase in fractional shortening. Detailed analyses of echocardiography parameters are in Extended Data Table 2 (n = 5). e IHC staining of GRP78 or CAT (cyan), tropomyosin (red), and nuclei (TOPRO-3, white) in LV of mice from respective experiments. Tissue sections are representative images from one mouse per condition. Scale bar represents 50 µm. Data are represented as mean ± s.e.m. Two-group comparisons were performed using Student’s two-tailed t test, and all multiple group comparisons were performed using a one-way ANOVA with a Newman–Keuls post hoc analysis. *P ≤ 0.05 and **P ≤ 0.01; ns not significant

