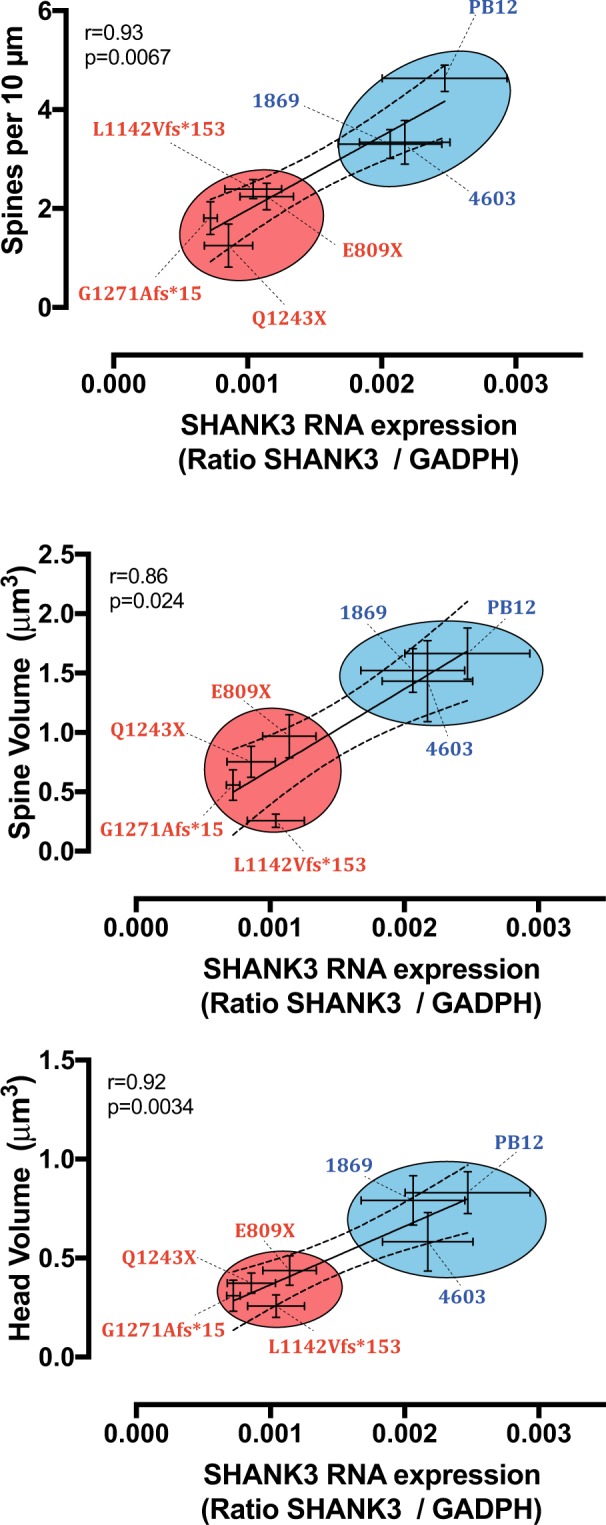
Figure 5.

Correlation analysis between SHANK3 expression and alterations in dendritic spine parameters in iPSC-derived neurons from control individuals and patients with ASD. Upper graph, Correlation between SHANK3 mRNA and spine densities. Middle graph, Correlation between SHANK3 mRNA and total spine volume. Lower graph, Correlation between SHANK3 mRNA and head spine volume. Statistical analysis was performed using GraphPad Prism Version 6 software (GraphPad, sand Diego, California, USA). Data are mean ± SEM. Coefficients were calculated using Spearman correlation method and are indicated in the graphs with statistical significance.
