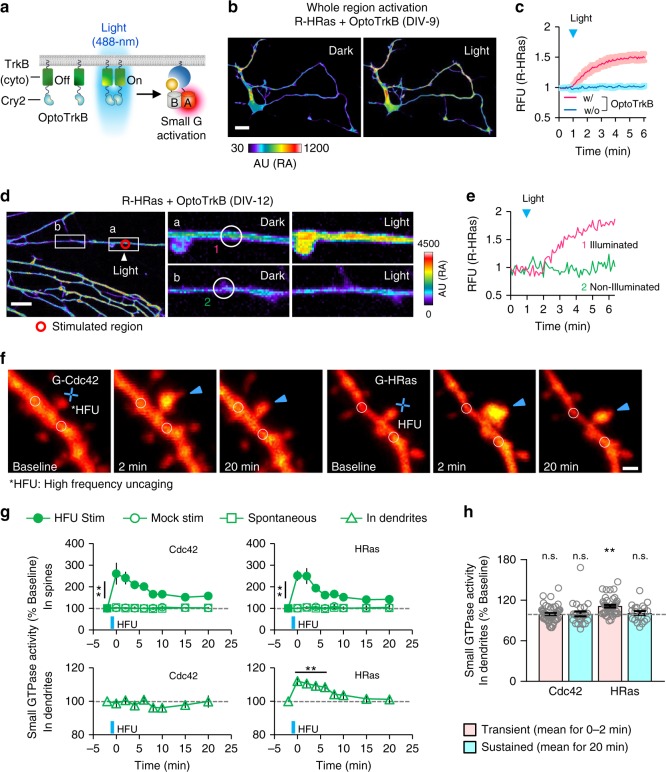
Fig. 2.
Spatiotemporal visualization of small GTPase activation in dendrites and single spines upon optoTrkB activation and LTP induction. a Schematic of Ras activation by blue light-mediated OptoTrkB activation. b Cultured hippocampal neuron (DIV-9) showing fluorescence change of R-HRas upon blue light-induced whole cell activation of OptoTrkB. Whole-cell activation; light was globally illuminated in the whole field of view. c Time-lapse measurement showing fluorescence change of R-HRas upon light stimulation. n = 4 (red), 6 (blue). Scale bar, 20 μm. d (left) images showing local fluorescence increase of R-HRas intensity upon OptoTrkB activation. Local stimulation was applied to a small region of dendrite (indicated by red circle) of hippocampal neuron (DIV-12) at t = 1 min. (right) Enlarged images of the indicated regions (white boxes) showing fluorescence change of R-HRas at the region of illumination and a distal dendrite. Scale bar, 20 μm. e Time-lapse graph showing fluorescence changes of R-HRas within regions indicated by white circles in d (magenta; nearby stimulation, green; distal from stimulation). f Time-lapse images of dendrites from layer 2/3 pyramidal neurons co-expressing tdTomato (red) and small GTPases sensors, G-Cdc42 (left) and G-HRas (right). Target spines (arrowheads) were exposed to HFU (blue crosses). g Time-lapse measurement showing fluorescence changes of G-Cdc42 and G-HRas in HFU-stimulated spines (top) and nearby dendrites (bottom, indicated by white circles in f, < 2.5 μm from target spines). Filled circles, G-Cdc42: **P < 0.01 at all post-HFU time points; n = 26 spines, 22 cells; G-HRas: **P < 0.01 at all post-HFU time points; n = 22 spines, 19 cells. Open circles, G-Cdc42: n = 10 spines, 10 cells; G-HRas: n = 11 spines, 11 cells. Open squares, G-Cdc42: n = 23 spines, six cells; G-HRas: n = 23 spines, six cells. Triangles (G-Cdc42), n = 26 spines, 22 cells. Triangles (G-HRas), **P < 0.01 up to 6 min; n = 22 spines, 19 cells. h Graph showing relative changes of fluorescence of G-Cdc42 and G-HRas in dendrites in different time periods (transient and sustained) following HFU. **P < 0.01. Statistical analysis were performed by Student’s two-tailed t test; n.s., not significant. *HFU: high-frequency uncaging; RFU: relative fluorescence unit; AU: arbitrary unit; Error bars: s.e.m. Images or quantified data are representatives of multiple experiments (N > 3)

