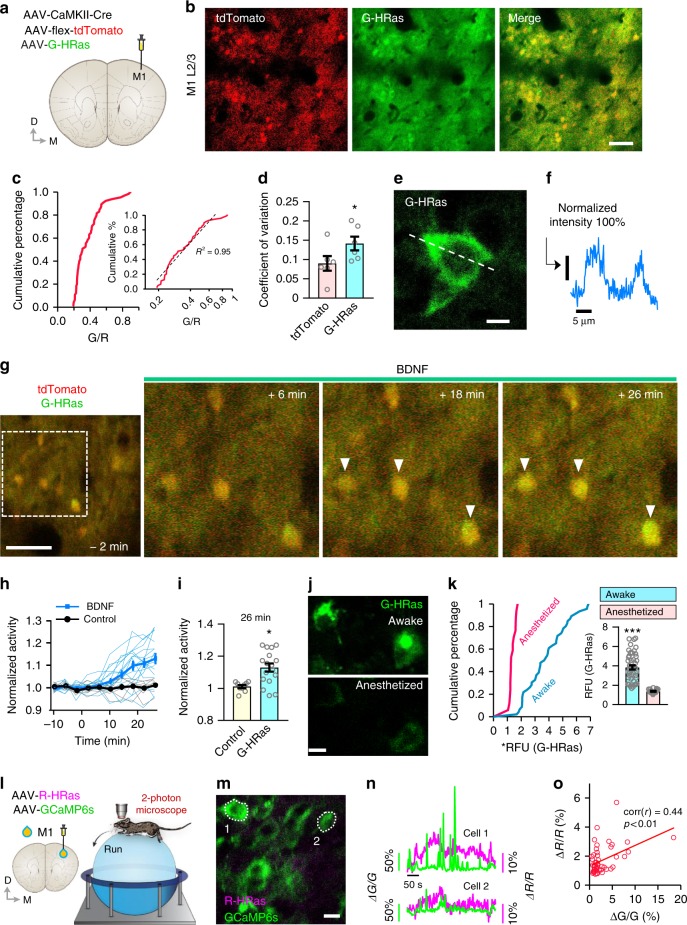
Fig. 3.
Visualizing real-time dynamic changes of Ras activity in the intact brains of freely behaving mice. a Schematic depiction of virus injection and imaging positions. b In vivo two-photon imaging of G-HRas in layer 2/3 neurons. Scale bar, 100 μm. c Cumulative distribution of G/R ratio (n = 65 cells). Log-normal scaled plot of the distribution (inset, R2 = 0.95). d Coefficient of variation for tdTomato and G-HRas signals (average ± s.e.m: 9.01 ± 1.89 for tdTomato; 14.2 ± 1.79 for G-HRas). e A representative image of G-HRas expression in the cell body. Scale bar, 10 μm. f Normalized intensity profile of G-HRas expression across the cell body, indicated as a dotted line in e. g Time-lapse imaging of G-HRas fluorescence with BDNF treatment. h Individual and average time course graph of normalized activity of G-HRas (n = 17 cells for BDNF; n = 9 cells for control). i Comparison of G-HRas activity between control and BDNF groups (average ± s.e.m: 1.01 ± 0.01 for control; 1.13 ± 0.025 for BDNF). j Representative images of G-HRas activity in awake (top) and anesthetized (bottom) states. k Cumulative distribution of normalized G-HRas intensity in awake and anesthetized states (n = 46 cells, awake; n = 17 cells, anesthetized). Comparison of average G-HRas intensity (inset) (average ± s.e.m: 3.84 ± 0.22, awake; 1.37 ± 0.05, anesthetized). l Schematics of virus injection and two-photon microscopy in mice running on a spherical treadmill. m A representative image of neurons expressing R-HRas and GCaMP6s. n Traces of R-HRas and GCaMP6s signals from two exemplary neurons. o Correlation between R-HRas and GCaMP6s signals (n = 49 cells, Pearson’s r = 0.44). *P < 0.05, ***P < 0.001 by Student’s two-tailed t -test. RFU: relative fluorescence unit. Images or quantified data are representatives of multiple experiments (N > 3). BDNF brain-derived neurotrophic factor

