Figure 5.
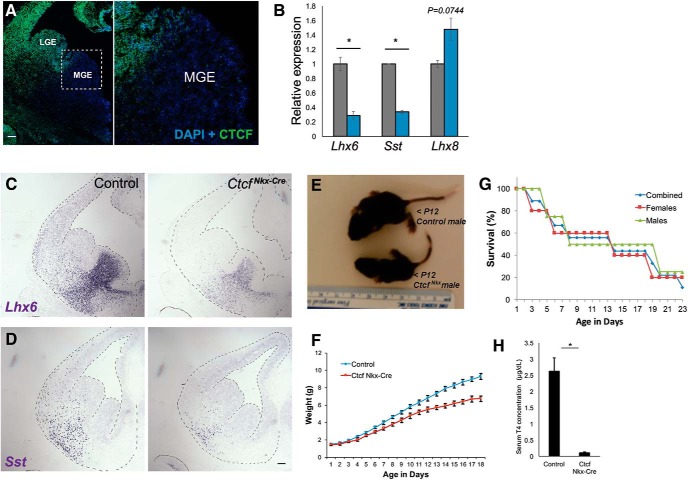
MGE-specific Ctcf deletion replicates gene expression changes and extends postnatal survival. A, CTCF immunofluorescence (green) of E13.5 CtcfNkx-Cre coronal brain sections. Nuclei are counterstained with DAPI. Higher-magnification view of the MGE is shown on the right. Scale bar, 100 mm. B, qRT-PCR of Lhx6, Sst, and Lhx8 in control (gray) and CtcfNkx-Cre (blue) E14 telencephalon normalized to β-actin (n = 3). C, D, ISH of Lhx6 and Sst in E13.5 coronal sections. Scale bar, 100 mm. Tissue is outlined for ease of visualization. E, Representative image of a 12-d-old CtcfNkx-Cre male mouse and littermate control. F, Weight of CtcfNkx-Cre (n = 4) and littermate controls (n = 12) over time. Error bars indicate SEM. G, Survival curve of CtcfNkx-Cre mice (males = 4; females = 5). Five animals were killed due to severe distress or imminent death. H, Quantification of serum T4 from P20–P22 CtcfNkx-Cre mice and control siblings by ELISA. Error bars indicate SEM. n = 6 pairs. Asterisk indicates p < 0.05 by Student's t test.

