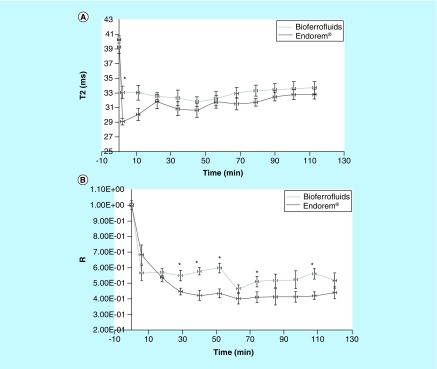
Figure 6. . Liver MRI study.
Transverse relaxation time values (A) and signal intensity ratio values (B) of bioferrofluids and Endorem® in liver during 2 h after contrast agent injection. Data are presented as (mean ± SEM).
*Marks significant differences between Endorem and bioferrofluids, according to Mann–Whitney test, n = 10.

