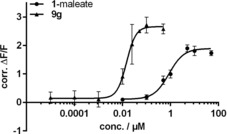
Figure 3.

Concentration‐response curves of 1 (as maleate salt) and 9 g obtained with fluorescence‐based thallium‐flux KV7.2/3 channel‐opening assay; determined after 30 min exposure; data were normalized to control (1 % DMSO); values are the mean±SD (n≥3); EC50 values calculated from log(concentration)‐response curves which fit a four‐parameter logistic equation.
