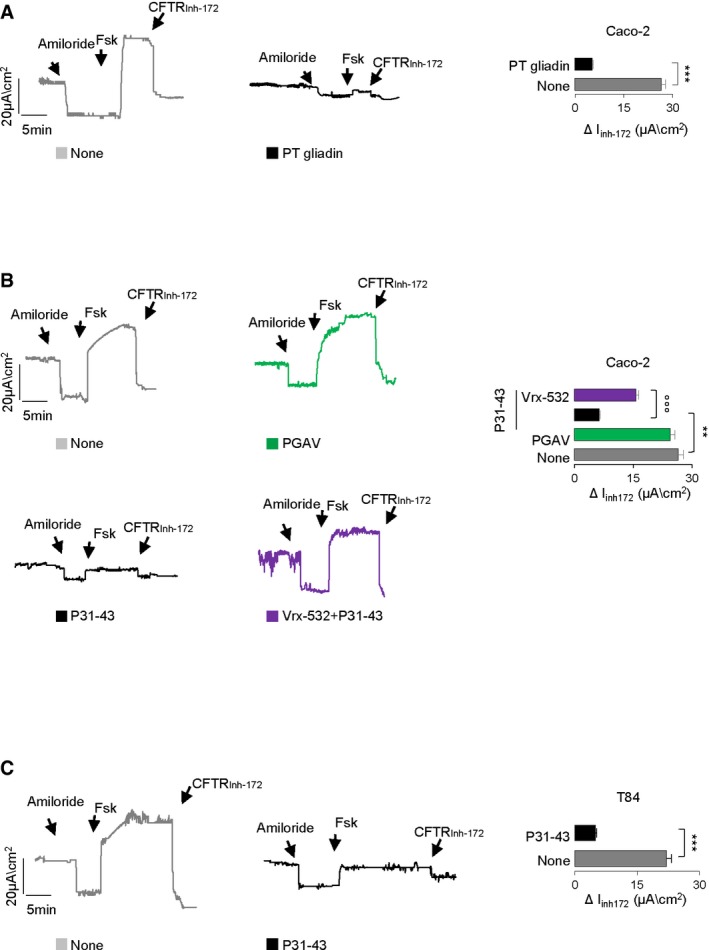
Figure EV1. Effects of gliadin and gliadin peptides on CFTR channel function in intestinal epithelial cells.

-
A–CTreatment of Caco‐2 cells (A, B) or T84 (C) cells with a PT gliadin (500 μg/ml) (A) or P57–68 or PGAV or P31–43 (20 μg/ml; 3 h) in the presence or absence of pre‐treatment with Vrx‐532. CFTR‐dependent Cl− secretion measured by means of forskolin‐induced (Fsk) increase in the chloride current [Isc (μA/cm2)] in cells mounted in Ussing chambers; quantification of the peak CFTR Inhibitor 172 (CFTRinh172)‐sensitive Isc (∆Isc; n = 3 independent experiments). Mean ± SD of samples assayed. ***P < 0.001 vs. PT gliadin (A) or vs. P31–43 (C) or **P < 0.01 vs. P31–43 (B), °°°P < 0.01 vs. P31–43 + Vrx‐532.
Source data are available online for this figure.
