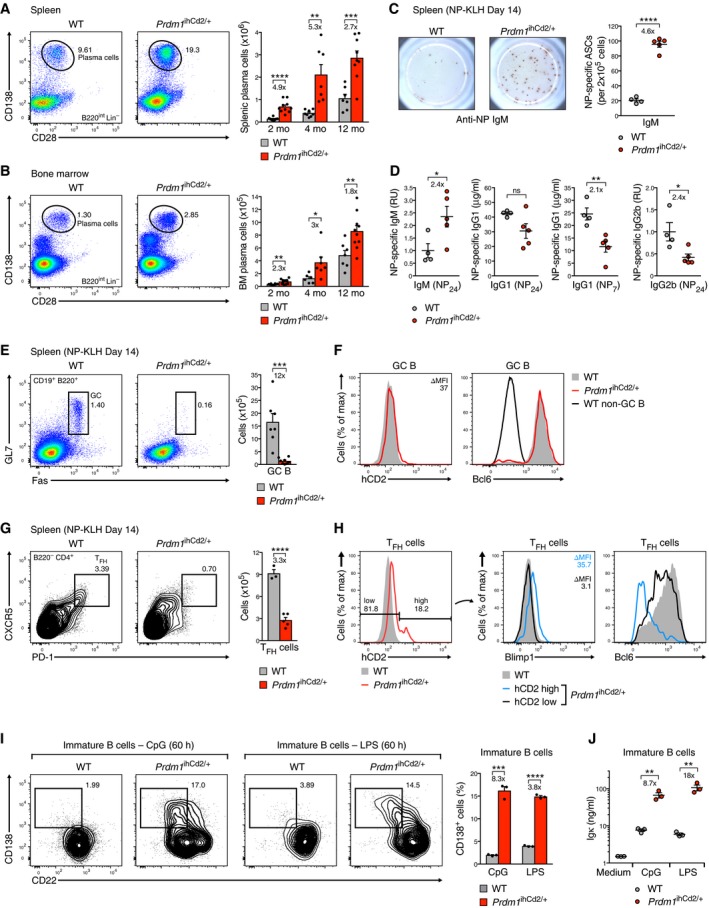
Figure 5. Increased plasma cell development and decreased TFH cell differentiation in the absence of GC B cell formation in Prdm1 ihCd2/+ mice.

-
A, BFlow cytometric analysis of plasma cells from the spleen (A) and bone marrow (B) of Prdm1 ihCd2/+ and wild‐type (WT) mice under steady‐state conditions. Representative flow cytometric data are shown for 12‐month‐old mice (left), while bar graphs present absolute numbers of plasma cells for Prdm1 ihCd2/+ (red) and wild‐type (gray) mice at the age of 2, 4, and 12 months (right). The total number of cells in the spleen and bone marrow of the analyzed mice is shown in Appendix Fig S5A.
-
C, DT cell‐dependent immune responses. Prdm1 ihCd2/+ (red dots) and wild‐type (gray dots) mice at the age of 2 months were immunized with NP‐KLH (in alum) and analyzed at day 14 after immunization by ELISPOT assay (C) and ELISA (D). The number of anti‐NP‐IgM antibody‐secreting cells (ASCs) in the spleen was determined by ELISPOT assay (C) using NP24‐BSA‐coated plates for detecting cells secreting total anti‐NP‐IgM antibodies. ELISPOT results are shown as representative pictures (left) or absolute ASC numbers (right) (C). The serum titers of anti‐NP‐specific IgM, IgG1, and IgG2b antibodies were analyzed by ELISA using NP7‐BSA‐ or NP24‐BSA‐coated plates for detecting high‐affinity IgG1 or total IgM, IgG1, and IgG2b antibodies, respectively (D). Dot plots display the serum immunoglobulin titers of Prdm1 ihCd2/+ (red dots) and wild‐type (gray dots) mice. NP‐specific IgG1 concentrations (μg/ml) were determined relative to a standard NP‐binding IgG1 antibody, whereas IgM and IgG2b amounts are indicated as relative units (RU) by setting the WT data to 1. The total number of splenocytes in the immunized mice is shown in Appendix Fig S5E.
-
E, FFlow cytometric analysis of splenic GC B cells in Prdm1 ihCd2/+ (red) and wild‐type (gray) mice (at the age of 2 months) at day 14 after NP‐KLH immunization. Bar graphs display absolute numbers of GC B cells detected in the spleen of both genotypes (E). Cell surface expression of hCD2 and intracellular staining of Bcl6 are shown for Prdm1 ihCd2/+ (red) and wild‐type (gray) GC B cells (F). The absence of Bcl6 expression in non‐GC B cells (black) is shown as reference.
-
G, HFlow cytometric analysis of splenic TFH cells from the same mice analyzed in (E, F). Bar graphs indicate absolute numbers of TFH cells (G), and histograms display cell surface expression of hCD2 and intracellular staining of Bcl6 (H) in hCD2lo (black) and hCD2hi (blue) Prdm1 ihCd2/+ as well as wild‐type (gray) TFH cells.
-
IEfficient in vitro plasmablast differentiation of immature B cells. Immature B cells sorted from the bone marrow of Prdm1 ihCd2/+ (red) and wild‐type (gray) mice were stimulated with CpG oligodeoxynucleotides or LPS for 60 h followed by flow cytometric analysis of CD138+CD22lo plasmablasts (PB). Bar graphs (right) summarize the plasmablast data of the CpG and LPS stimulation experiments.
-
JELISA detection of Igκ‐containing antibodies in the supernatants of immature B cells at 60 h of CpG or LPS stimulation.
