-
A
-
B
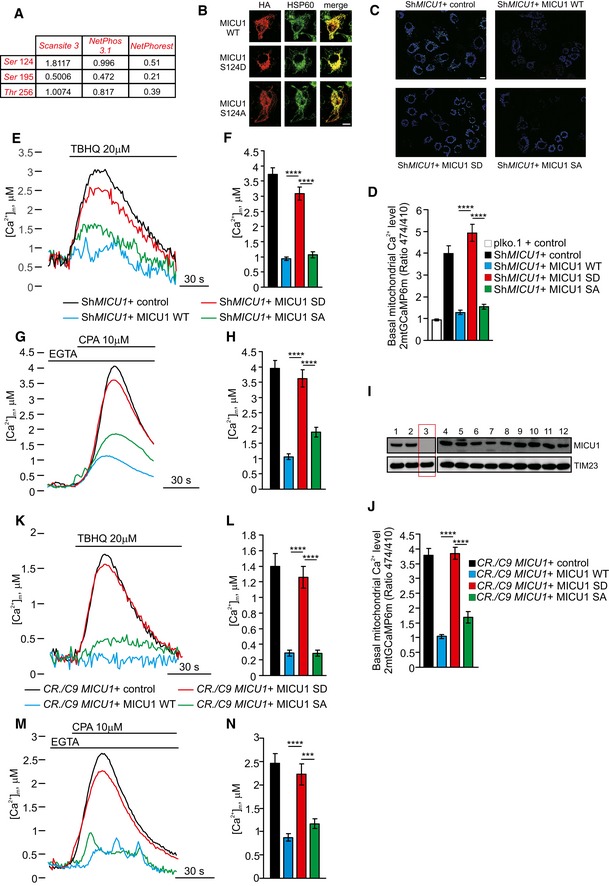
HeLa cells overexpressing the HA‐tagged MICU1 WT, MICU1 S124D, or MICU1 S124A mutants were stained for HA or HSP60 (mitochondrial marker). Merged images are indicated (merge). Scale bar 10 μm.
-
C
Representative images of the 2mt‐GCaMP6m 474/410 ratio of ShMICU1 HeLa stable cells expressing an empty vector (ctrl) or the MICU1 WT, MICU1 SD, and MICU1 SA. Scale bar 10 μm.
-
D
Resting mitochondrial calcium levels, evaluated through ratiometric imaging of the mitochondrial‐targeted GCaMP6m, in ShRNA control (plko) or ShRNA MICU1 HeLa stable clone cells transfected with the indicated constructs (n = 5 independent experiments; 55–67 cells).
-
E, F
Representative kinetics (E) and analysis (F) of aequorin‐based [Ca2+]m measurements in ShRNA MICU1 HeLa stable clone cells transfected with the indicated constructs and challenged with 20 μM 2,5‐di‐tert‐butylhydroquinone (TBHQ) in the absence of extracellular Ca2+ (n = 3 independent experiments).
-
G, H
Representative kinetics (G) and analysis (H) of aequorin‐based [Ca2+]m measurements in intact ShRNA MICU1 HeLa stable clone cells transfected with the indicated constructs and challenged with 10 μM cyclopiazonic acid (CPA) in the presence of 100 μM EGTA (n = 3 independent experiments).
-
I
Western blot analysis for the presence of MICU1 in clones arising from single cells generated by CRISPR/Cas9‐mediated genome editing. The results for 12 of the 36 clones that were examined are shown.
-
J
Resting mitochondrial calcium levels, evaluated through ratiometric imaging of the mitochondrial‐targeted GCaMP6m, in MICU1 KO cells generated using the CRISPR/Cas9 technique and transfected with the indicated constructs (n = 3 independent experiments; 30–56 cells).
-
K, L
Representative kinetics (K) and analysis (L) of aequorin‐based [Ca2+]m measurements in intact MICU1 KO cells generated using the CRISPR/Cas9 technique, transfected with the indicated constructs, and challenged with 20 μM TBHQ in the absence of extracellular Ca2+ (n = 3 independent experiments).
-
M, N
Representative kinetics (M) and analysis (N) of aequorin‐based [Ca2+]m measurements in intact MICU1 KO cells generated using the CRISPR/Cas9 technique, transfected with the indicated constructs, and challenged with 10 μM CPA in the presence of 100 μM EGTA (n = 3 independent experiments).
Data information: (D, F, H, J, L, N) Means ± SEM. ***
< 0.0001 (one‐way ANOVA).

