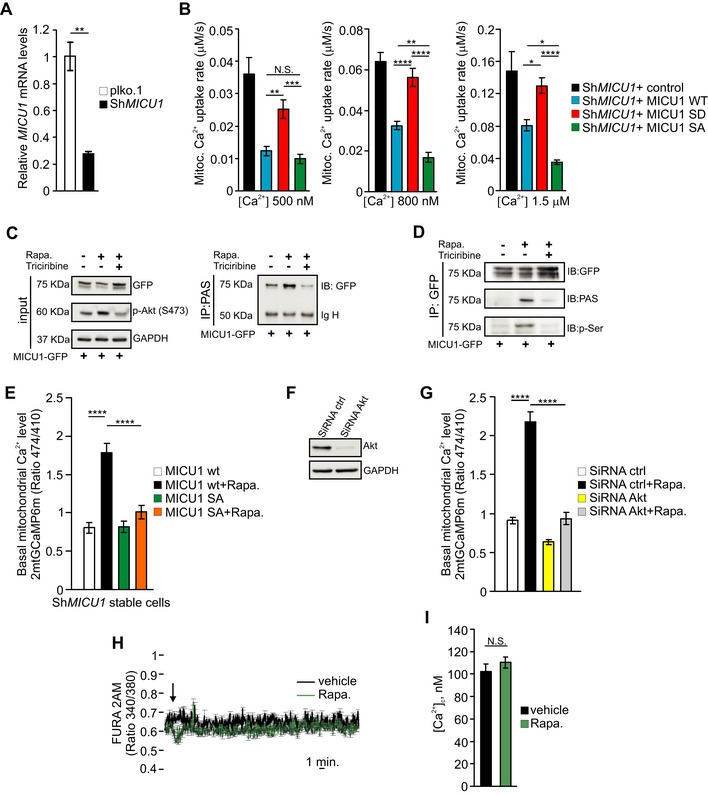
MICU1 mRNA levels in plko.1 and ShRNA MICU1 HeLa stable clone cells (n = 3 independent experiments).
Analysis of aequorin‐based [Ca2+]m measurements in permeabilized ShRNA MICU1‐HeLa cells transfected with the indicated constructs and challenged with 500, 800 nM or 1.5 μM buffered [Ca2+] (n = 3 independent experiments).
HEK293 cells were transfected with GFP‐tagged wild‐type (WT) MICU1 and then treated with 1 μM rapamycin (Rapa.) alone for 4 h or in combination with the Akt inhibitor triciribine (10 μM). The cell lysates were immunoprecipitated with PAS (phospho‐Akt substrate) antibody and then analyzed by Western blotting. IgH: immunoglobulin heavy chain.
HEK293 cells were transfected with either GFP‐tagged wild‐type (WT) MICU1 or MICU1 S124A‐GFP mutant and treated as in (C). MICU1‐GFP immuno complexes were precipitated with a GFP antibody and analyzed with PAS (phospho‐Akt substrate) and phosphoserine (p‐Ser) antibodies by Western blotting.
Resting mitochondrial calcium levels, evaluated through ratiometric imaging of the mitochondrial‐targeted GCaMP6m, in ShRNA MICU1 HeLa stable clone cells transfected with the indicated constructs, treated with vehicle or 1 μM rapamycin for 4 h (n = 3 independent experiments; 27–30 cells).
Western blot analysis of Akt levels in HeLa cells silenced with scramble (ctrl) or Akt siRNAs.
Resting mitochondrial calcium levels, evaluated through ratiometric imaging of the mitochondrial‐targeted GCaMP6m, in HeLa cells silenced with the indicated constructs, treated with vehicle or 1 μM rapamycin for 4 h (n = 3 independent experiments; 40–63 cells).
FURA‐2 AM ratiometric measurements in HeLa cells upon stimulation with vehicle (DMSO) or 1 μM rapamycin (n = 3 independent experiments; 46–75 cells).
Calibrated FURA‐2 AM cytosolic [Ca2+] in HeLa cells treated with vehicle or 1 μM rapamycin for 4 h (n = 3 independent experiments; 50 cells).
Data information: (A, I) Means ± SEM. N.S. not significant; **
‐test); (B) Means ± SEM. N.S. not significant; *
< 0.0001 (one‐way ANOVA); (E, G) Means ± SEM. ****
< 0.0001 (two‐way ANOVA).