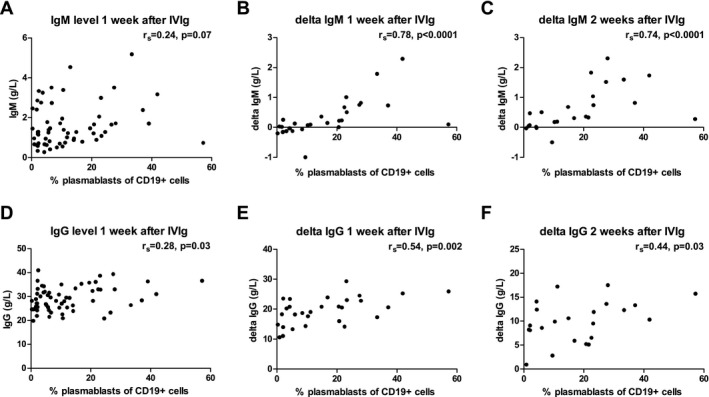
Figure 4.

The percent of plasmablasts after 1 week of IVIg treatment correlates with the rise in serum IgM and IgG levels. Serum IgM (A–C) and IgG (D–F) levels were determined before and after IVIg treatment and related to the percent of plasmablasts measured after 1 week of IVIg treatment. Absolute IgM/G levels are shown in A and D, the delta IgM/G levels at 1 week in B and E, and the delta IgM/G level at 2 weeks are indicated in C and F. Delta IgM/G levels were calculated compared to pretreatment levels, which were not available for all patients. Patients randomized for a second course of IVIg or placebo were excluded from analysis in C and F.
