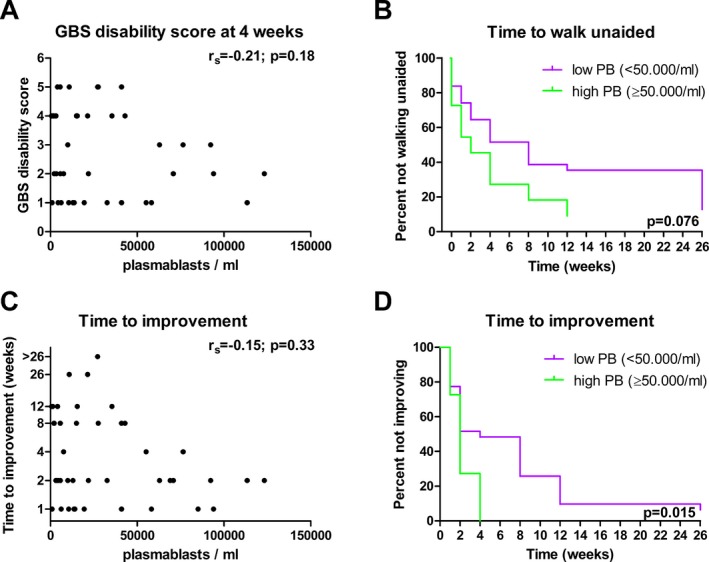
Figure 5.

Plasmablasts after IVIg treatment in relation to clinical outcome in GBS. The absolute number of plasmablasts in relation to the GBS disability score determined 4 weeks after IVIg therapy (A) or the time to improve one grade on the GBS disability scale (C; y‐axis in log2 scale; n = 43). The time to reach independent walking (B) that is a GBS disability score of two, and the time to improvement of one grade on the GBS disability scale (D) was compared in patients with high (≥50,000 cells/mL) and low absolute numbers (<50,000 cells/mL) using logrank testing (n = 42).
