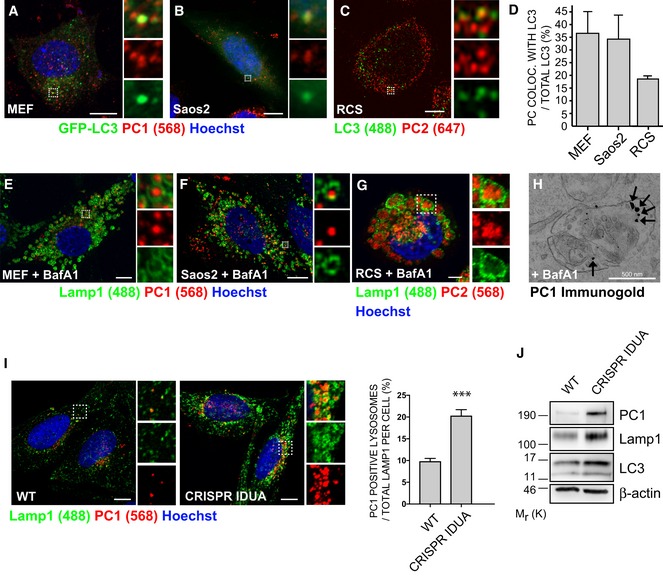
Figure 1. PCs are autophagy substrates and accumulate in lysosomes.

-
A, BAiryscan confocal analysis of PC1 (568, red) co‐localization with GFP‐LC3 (green) in (A) MEF (B) Saos2. Scale bars = 10 μm. The insets show higher magnification (A = x4.68; B = x6.76) and single colour channels of the boxed area.
-
CAiryscan confocal analysis of PC2 (647, red) co‐localization with LC3 (488, green) in RCS cells. Scale bars = 10 μm. The insets show higher magnification (x7.33) and single colour channels of the boxed area.
-
DQuantification of GFP (A, B) or LC3 (C) vesicles positive for PC1 or PC2, expressed as % of total LC3 (mean ± SEM), n = 18 cells (MEFs and Saos2); n = 12 (RCS) from three independent experiments.
-
E–GScanning confocal microscopy analysis of MEFs, Saos2 and RCS cells treated with BafA1, immunolabelled for PC1 or PC2 and LAMP1. Nuclei were stained with Hoechst. (E, F) Scale bars = 10 μm, (G) Scale bars = 5 μm. The insets show higher magnification (E = x4.99; F = x6.49; G = x2.01) and single colour channels of the boxed area.
-
HTransmission EM analysis in Saos2 cells, treated with BafA1, showing in detail a lysosome which contains immunolabelled PC1 (with nanogold particles), as indicated by arrows.
-
IScanning confocal microscopy analysis of Saos2 WT and CRISPR‐Cas9 IDUA Saos2 at steady state, immunolabelled for PC1 and LAMP1. Nuclei were stained with Hoechst. Scale bar = 10 μm. The insets show higher magnification (left = x3.09; right = x3.12) and single colour channels of the boxed area. Bar graph shows quantification of lysosomes containing PC1 expressed as % of total LAMP1 per cell (mean ± SEM). n = 31 WT cells, n = 33 CRISPR cells counted; three independent experiments. Student's unpaired, two‐tailed t‐test ***P < 0.0001.
-
JWT and CRISPR‐IDUA Saos2 lysed and analysed by Western blot. Data are representative of three independent experiments.
Source data are available online for this figure.
