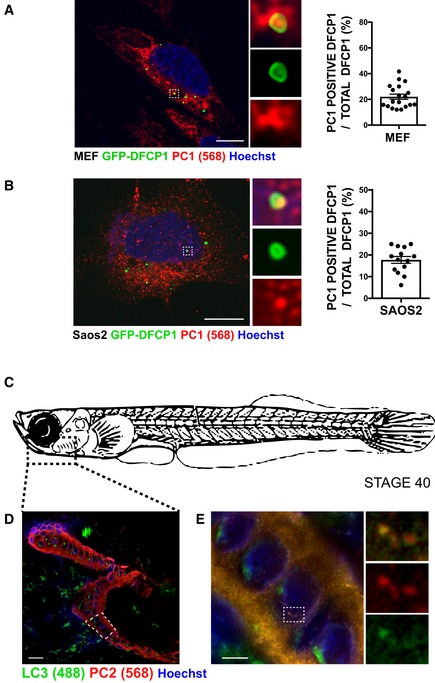
Figure EV1. PC is an autophagy substrate.

-
A, BScanning confocal analysis of immunofluorescence for PC1 (568, red) and GFP‐DFCP1 (green) in (A) MEF and (B) Saos2 and quantification of AVs positive for GFP‐DFCP1 containing PC1 expressed as % of total DFCP1 per cell (mean ± SEM). The insets show higher magnification (A = x5.9; B = x6.04) and single colour channels of the boxed area. Scale bar = 10 μm. (A) n = 19 and (B) n = 14 cells counted per condition; three independent experiments.
-
CSchematic representation of a stage 40 medaka fish. Dotted box represents area of mandible analysed in (D and E).
-
DScanning confocal image of mandible from stage 40 medaka, immunostained with LC3 (488, green) PC2 (568, red) and nuclei stained with Hoechst (blue). Dotted box represents area of mandible containing osteoblasts that was further analysed in (E). Scale bar = 20 μm.
-
EAiryscan confocal image of mandible at higher magnification, scale bar = 3 μm. Boxes on the right show magnification (x4.02) of boxed area.
