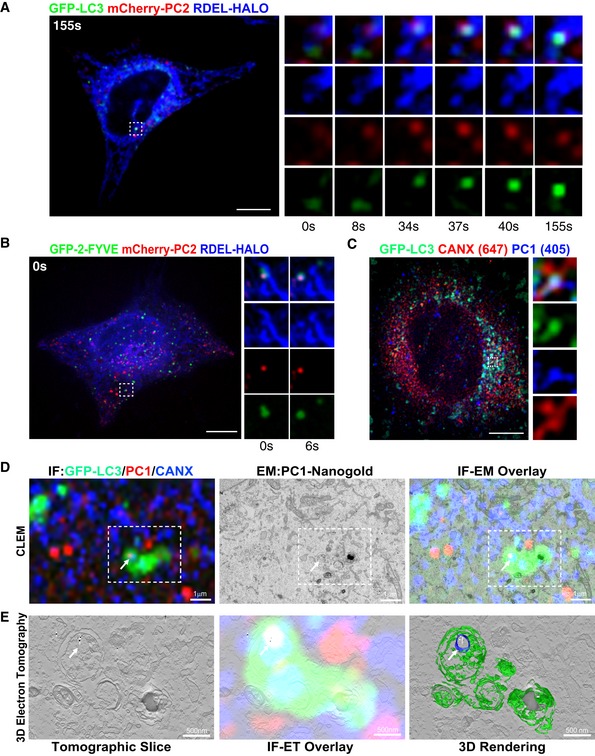
Figure 2. Autophagy sequesters PC molecules in the ER.

-
A, BU2OS expressing (A) GFP‐LC3 or (B) GFP‐2‐FYVE (green), mCherry‐PC2 (red) and RDEL‐HALO (blue) were imaged live by spinning disc microscopy. Single and merge channels time‐lapse stills at higher magnification (A = x3.93; B = x3.42) from the boxed region are shown on the right. Scale bar = 10 μm.
-
CAiryscan analysis of Saos2 cells expressing GFP‐LC3 (green) and immunolabelled for PC1 (405, blue) and CANX (647, red). The insets show higher magnification (x5.26) and single colour channels of the boxed area. Scale bar = 10 μm.
-
DCorrelative light electron microscopy (CLEM) and electron tomography of Saos2 cells transfected with GFP‐LC3 (green) and labelled for PC1 (568, red and nanogold particles) and CANX (647, blue). Cells were first imaged by confocal microscopy (top left panel), and then, the same region was retraced in EM (upper middle panel) and overlay is shown (upper right panel). Arrow indicates a LC3‐positive vesicle containing CANX and PC1 molecules.
-
ESingle tomography slice (left panel, taken from boxed are in D at a magnification of x2.84), overlay with immunofluorescence (IF) (central panel) and IF 3D rendering of AV (green) and the CANX positive vesicle containing gold particles of labelled collagen (blue and white, respectively) inside an AV (right panel).
