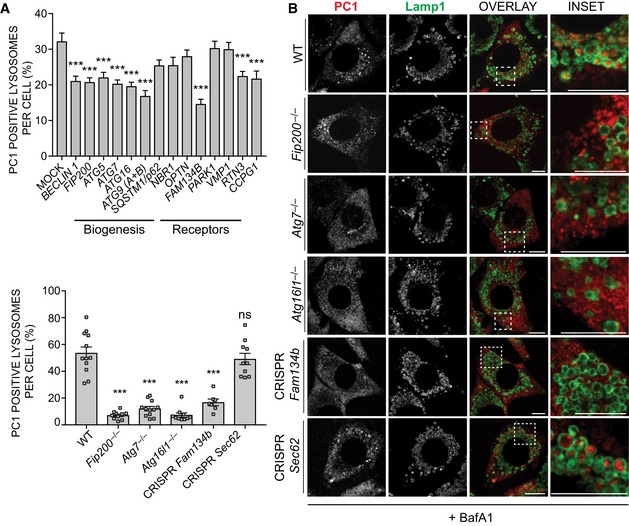
MEF cell lines lacking the expression of indicated genes were treated for 12 h with 50 nM BafA1, fixed and immunolabelled for PC1 (568, red) and LAMP1 (488, green). Scale bar = 10 μm. Insets show magnification of the boxed area. Bar graph (on the left) shows quantification of LAMP1 vesicles positive for PC1, expressed as % of total lysosomes (mean ± SEM), n = 12, 10, 12, 10, 7, 10 cells per genotype, respectively; three independent experiments. One‐way ANOVA with Dunnett's multiple comparisons test performed and P‐value adjusted for multiple comparisons. ns ≥ 0.05, ***P < 0.0001.

