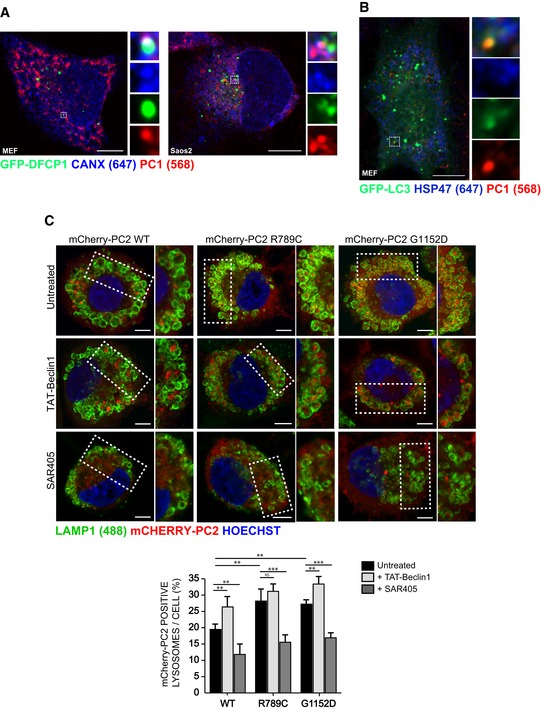
Mutant PC2 is targeted to lysosomes at a higher rate than WT, and modulated via autophagy. RCS cells were transiently transfected with mCherry‐PC2 WT, R789C or G1152D mutants (568, red) and treated for 6 h with 100 nM BafA1, and as indicated with SAR405 or Tat‐BECLIN‐1. Cells were fixed and immunolabelled for LAMP1 (488, green). Nuclei were stained with Hoechst (blue). The insets show higher magnification (top left to bottom right: x1.37, x1.2, x1.39, x1.34, x1.44, x1.07, x1.61, x1.7, x1.56). Scale bars = 10 μm. Bar graph shows quantification of LAMP1 vesicles positive for mCherry‐PC2, expressed as % of total lysosomes per cell (mean ± SEM), minimum of n = 11 cells per genotype. Two‐way ANOVA with Tukey's post hoc test performed and P‐value adjusted for multiple comparisons. ns ≥ 0.05, **P < 0.005; ***P < 0.0001.

