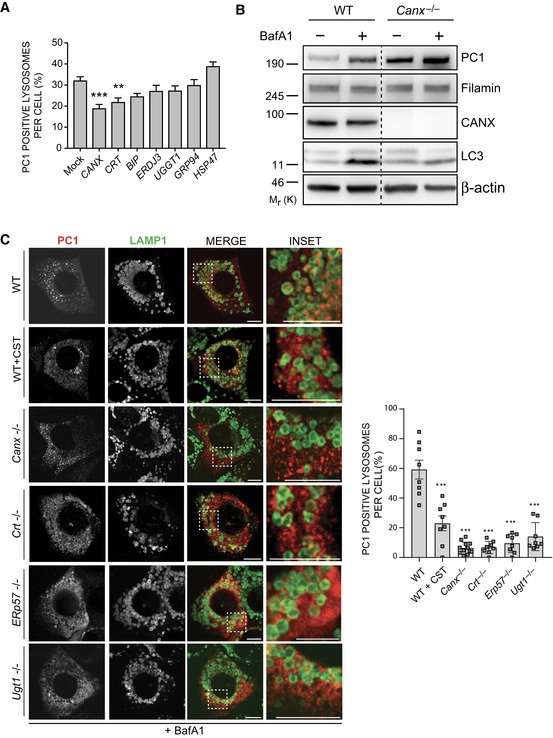
Figure 5. CANX is required for autophagic targeting of PC1.

- Bar graph shows quantification of lysosomes (LAMP1+) containing PC1 expressed as % of lysosomes (mean ± SEM) in Saos2 cells mock transfected or transfected with siRNA against the indicated genes, treated with 100 nM BafA1 for 9 h. n = 18 cells/treatment; three independent experiments. One‐way ANOVA with Dunnett's multiple comparisons test performed, **P < 0.005, ***P < 0.0001.
- WT and Canx −/− MEFs were untreated or treated with BafA1 (10 μM) for 6 h, lysed and analysed by Western blot with indicated antibodies. Filamin and β‐actin were used as loading control. Dashed line indicates that unnecessary lanes were removed. Western blot is representative of three independent experiments.
- MEF cell lines lacking the indicated genes were treated for 12 h with 50 nM BafA1 fixed and immunolabelled for PC1 (568, red) and LAMP1 (488, green). CST was added where indicated. Scale bar = 10 μm. Inset panels show magnification of the boxed area. Bar graph on the right shows quantification of LAMP1 vesicles positive for PC1, expressed as % of total lysosomes (mean ± SEM), n = 8, 8, 12, 8, 8, 8 cells, respectively; three independent experiments. One‐way ANOVA with Dunnett's multiple comparisons test performed and P‐value adjusted for multiple comparisons. ***P < 0.0001.
Source data are available online for this figure.
