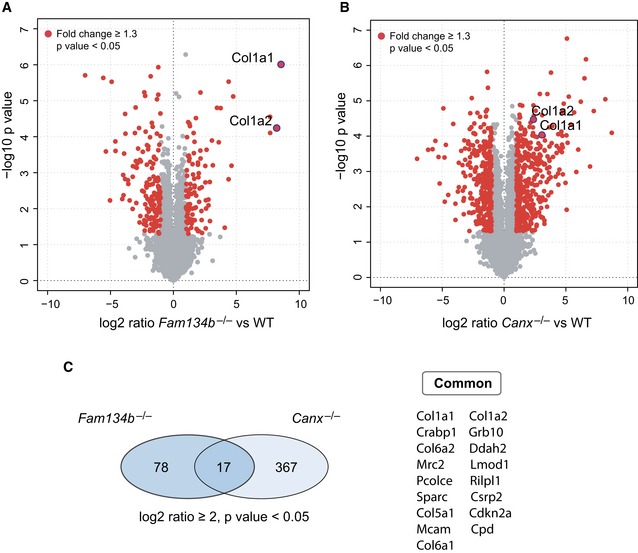
Figure 6. PCs are the main substrates of CANX‐FAM134B complex.

-
A, BVolcano plot comparing protein fold changes between WT versus Fam134b −/− (A) and WT versus Canx −/− MEFs (B). Significantly regulated proteins are labelled in red (log2 fold change > 1, −log10 P > 1.3). Red dots with blue ring indicate collagen 1 peptides. Graphs represent statistics from three separate experiments for each genotype.
-
CLeft: Venn diagrams represent the number of identified peptides significantly enriched in Fam134b −/− and Canx −/− MEFs. Right: List of peptides upregulated in both Fam134b −/− and Canx −/− MEFs.
