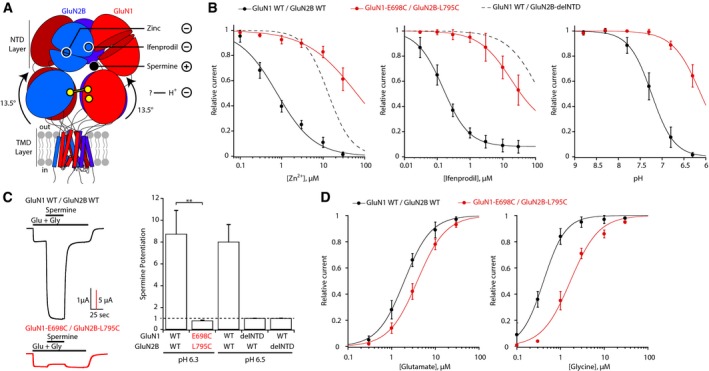
Figure 3. Super‐active receptors are insensitive to NTD‐mediated allosteric modulation.

- Schematic representation of the super‐active GluN1‐E698C/GluN2B‐L795C receptor locked in the “rolled” conformation, showing the NTD‐binding sites for spermine, zinc, and ifenprodil, positive (+) and negative (−) allosteric modulators, respectively. Open circles indicate that the binding site is on the other side of the GluN2B NTD. The allosteric inhibitor H+ is also indicated, although its binding site remains ill‐defined.
- Zinc, ifenprodil, and pH dose–response curves of wild‐type (WT) GluN1/GluN2B receptors and mutant GluN1‐E698C/GluN2B‐L795C receptors. For comparison, zinc and ifenprodil dose–response curves of GluN1/GluN2B receptors lacking the whole GluN2B NTD (GluN1 WT/GluN2B‐delNTD) are also shown (dashed lines; data from Rachline et al, 2005). Values of IC50, maximal inhibition, Hill coefficient, and n are given in Appendix Table S3. Error bars, SD.
- Spermine (200 μM, pH 6.3) potentiation of WT GluN1/GluN2B and mutant GluN1‐E698C/GluN2B‐L795C receptors. Spermine (200 μM, pH 6.5) sensitivity is also shown for WT GluN1/GluN2B receptors and receptors lacking either the GluN1 (GluN1‐delNTD/GluN2B WT) or GluN2B (GluN1 WT/GluN2B‐delNTD) NTD (data from Mony et al, 2011). Mean values and n are given in Appendix Table S3. **P < 0.01, one‐way ANOVA on ranks followed by Bonferroni‐corrected Dunn's test. Error bars, SD.
- Glutamate and glycine dose–response curves of WT GluN1/GluN2B receptors and mutant GluN1‐E698C/GluN2B‐L795C receptors. Values of EC50, Hill coefficient, and n are given in Appendix Table S3. Error bars, SD.
