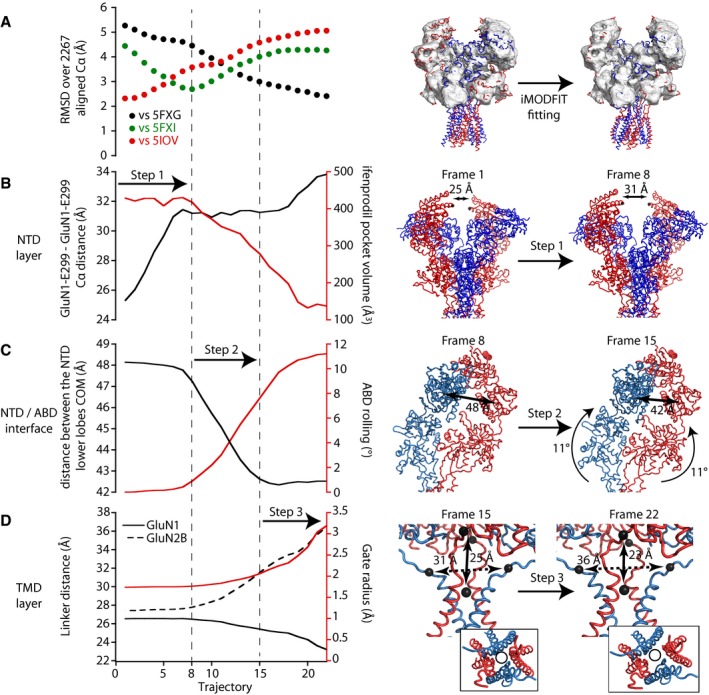
B–DLeft, evolution of selected collective variables during the iMODfit simulation. Each plot illustrates two collective variables, each with its own y‐axis (black or red). The upper panel (B) focuses on the NTD region (distance between the two GluN1 NTDs at the “apex” of the receptor; volume of the ifenprodil binding pocket at the interface between GluN1 and GluN2B NTDs), the middle panel (C) on the distance between NTD lower lobes and the ABD rolling motion, and the lower panel (D) on the ABD‐TMD connection and the M3 channel gate dilation. Right, illustration of the three steps of the fitting showing in step 1 (frame 1–8) the reduction of the inter NTD dimer distance; in step 2 (frame 8–15), the NTD lower lobes getting closer and the associated rolling of the ABD dimers; in step 3 (frame 15–22), the distance changes in the ABD‐M3 linker and the channel gate radius. The inset highlights a top view of the pore lining helixes M2 (P‐loop) and M3 with a same‐size circle emphasizing pore dilation during step 3. The GluN1 linker distance represents the distance between the center of masses (COM) of both GluN1‐R663 residues and the COM of the M3 SYTANLAAF sequence residues, and GluN2B linker distance represents the distance between both GluN2B‐E658 residues.

