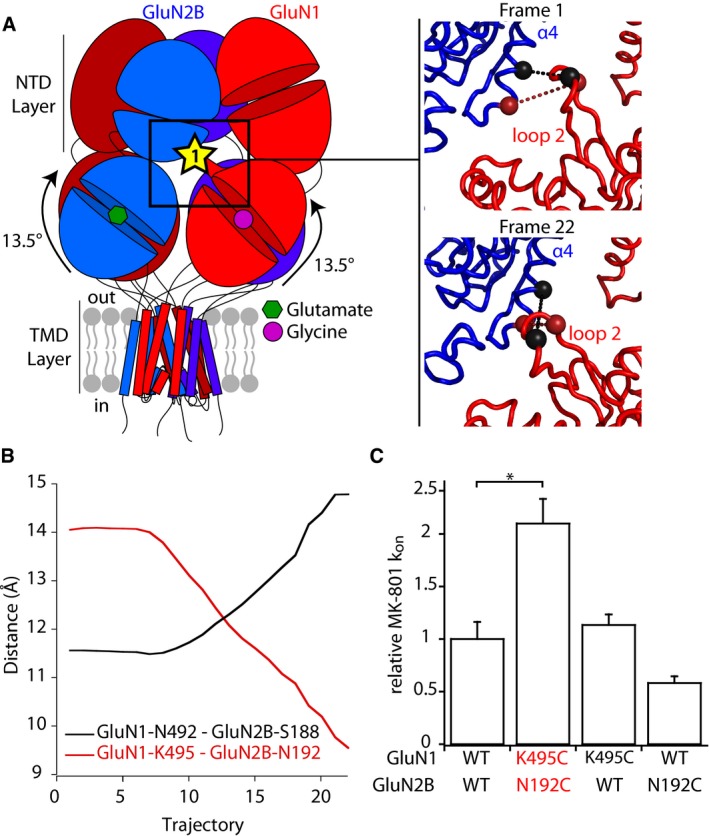
Figure 5. Structural mobility of an inter‐layer GluN1 protruding loop during rolling.

- Left, localization of interface 1 between GluN1 ABD and GluN2B NTD. This interface involves a GluN1‐specific loop that protrudes from GluN1 ABD upper lobe toward GluN2B NTD lower lobe. Right, initial and final frames of the fitting presented in Fig 4 at interface 1. The two pairs of residues targeted for cysteine mutations GluN1‐N492/GluN2B‐S188 and GluN1‐K495/GluN2B‐N192 are shown as spheres linked by a dotted line colored black and red, respectively.
- Evolution of Cα‐Cα distances of the two pairs of residues GluN1‐N492/GluN2B‐S188 and GluN1‐K495/GluN2B‐N192 during the fitting.
- MK‐801 inhibition kinetics. On‐rate constants (k on) of inhibition by 10 nM MK‐801 on wild‐type (WT) and mutant receptors. All values are normalized to that obtained for WT GluN1/GluN2B receptors. Values of Mean and n are given in Appendix Table S2. *P < 0.05, one‐way ANOVA on ranks followed by Bonferroni‐corrected Dunn's test. Error bars, SD.
