
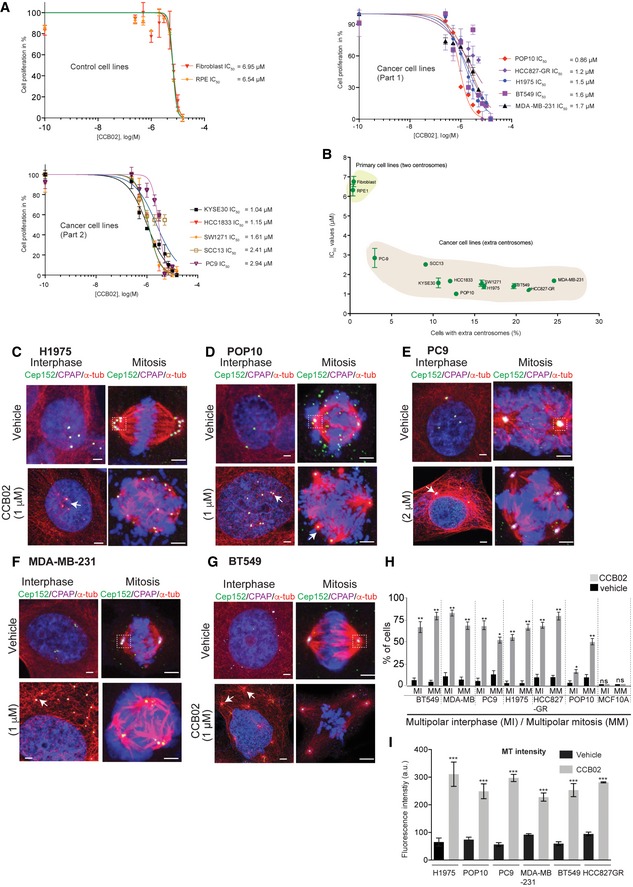
Figure EV2. Related to Fig 3: CCB02 impairs proliferation of extra centrosomes‐containing cells.
-
ADose–response curves of control (fibroblast and RPE) and cancer cell lines (separated as part 1 and 2) in response to CCB02 treatment. IC50 values were calculated after 72 h of treatment. MTS assay was used to calculate IC50 values (detailed description is given in the Materials and Methods section). Each data point is representative of three independent experiments. (N) = 3. Error bars, mean ± SEM.
-
BCorrelation of IC50 values to the percentage of cells containing extra centrosomes. An enhanced sensitivity of CCB02 is observed with cells harboring extra centrosomes. While cells with extra centrosomes segregate to the right side of the graph exhibiting lower IC50 values, two centrosome‐containing control cells segregate to the upper left side of the graph exhibiting higher IC50 values. Data represent mean ± SEM. (N) = 3. Pearson correlation coefficient was calculated for XY pairs (r = −0.86). ***P < 0.0001. Also refer Appendix Fig S1Aii for percentages of cells exhibiting extra centrosomes.
-
C–GCCB02 treatment prevents extra centrosomes of cancer cells from clustering by activating them to nucleate an enhanced level of microtubules prior to mitosis (Arrows). Activated centrosomes fail to cluster, instead of causing multipolar mitosis. H1975T790M, POP10, PC9, MDA‐MB‐231, and BT549 cancer cells exhibiting extra centrosomes were used. For cell‐based assays, CCB02 was used in the range of 1–2 µM concentrations depending on the estimated IC50 values for respective cell lines. All these cells were stained with Cep152 (green), CPAP (magenta), microtubules (α‐tubulin, red), and DNA (DAPI blue). Scale bar, 2 µm.
-
HBars show percentages of multipolar interphase (MI) and multipolar mitotic cells (MM) after 48 h of CCB02 treatment. Compared to vehicle treatment, CCB02 treatment causes multipolar spindles in both interphase and mitosis. (N) = 3 with total number of cells > 300 in each cell line. Error bars, mean ± SEM. Unpaired t‐test. *P < 0.01, **P < 0.001. Note that CCB02 does not affect two centrosome‐containing MCF10A wild‐type cells.
-
IBar graphs show MT intensities of interphase cells from the figure panels (C–G). Error bars, mean ± SEM. Two‐way ANOVA test. ***P < 0.0001.