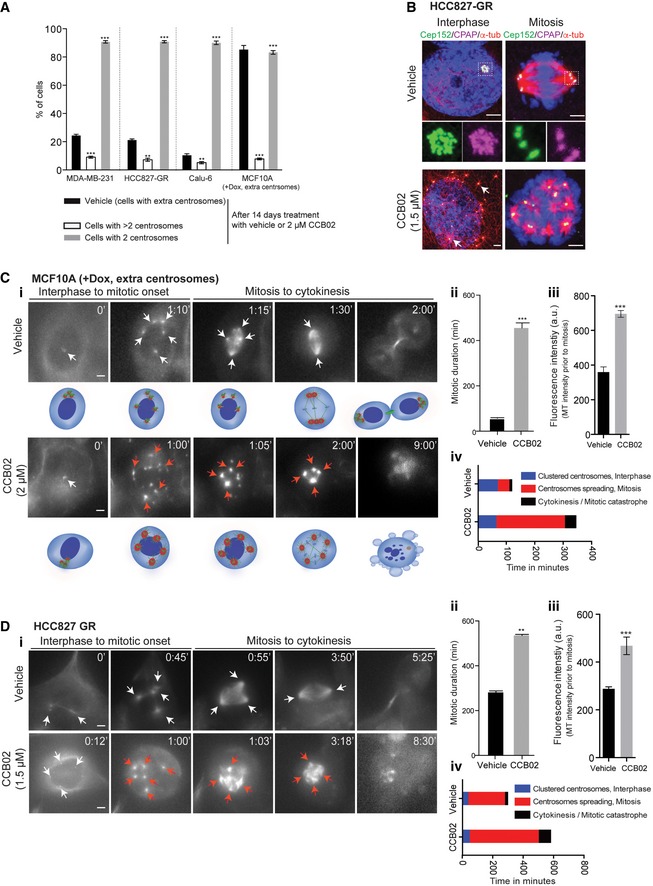
Figure 3. CCB02 prevents proliferation of cells with centrosome amplification.

-
AFourteen‐day CCB02 treatment of MDA‐MB‐231, HCC827‐GR, Calu‐6, and MCF10A (+Dox, extra centrosomes) mostly eliminated cells with extra centrosomes. At the end of the treatment, cells were fixed and stained for centrosomes. Bar graph shows the percentage of cells displaying two and more than two centrosomes. “Vehicle” at the bar graph indicates percentages of cells with extra centrosomes (also refer to Appendix Fig S1A). Note that percentages of cells containing more than two centrosomes are significantly reduced upon CCB02‐treatment (open bars). Data represent mean ± SEM of three independent experiments. (N) = 3, (n = 70). P‐values were obtained using unpaired t‐test **P < 0.001, ***P < 0.0001.
-
BCCB02 treatment prevents centrosome clustering in HCC827‐GR cells. Activated centrosomes (arrows) fail to cluster leading to multipolar mitosis. Cells were stained with Cep152 (green), CPAP (magenta), and microtubules (α‐tubulin, red). Scale bar, 2 μm, Insets, 0.5 μm.
-
C, DTime‐lapse images show the effect of CCB02‐mediated centrosome activation in cell cycle progression of MCF10A (+Dox, extra centrosomes) (C), HCC827‐GR (D) cells. White arrows indicate centrosome dots. Red arrows (in CCB02‐treated cells) indicate activated centrosomes with enhanced microtubule intensity compared to vehicle‐treated cells. Note, centrosome activation, declustering, and prolonged multipolar mitosis occur only with CCB02 treatment. Cartoons of a cell with extra centrosomes below to the panel (C) represent various events occurring upon vehicle or CCB02 treatment. Scale bar, 2 μm. Bar graphs at right to panel (C) and (D) quantify mitotic duration (ii), quantify microtubule intensity prior to mitosis (iii), and depict relative events occurring in cells treated with vehicle or CCB02 (iv). At least 100 cells were analyzed in each condition. (N) = 3. Error bars, mean ± SEM. Unpaired t‐test **P < 0.001, ***P < 0.0001.
