
Figure EV3. Related to Fig 3: Inhibiting CPAP–tubulin interaction activates spindle assembly checkpoint in extra centrosomes‐containing cells.
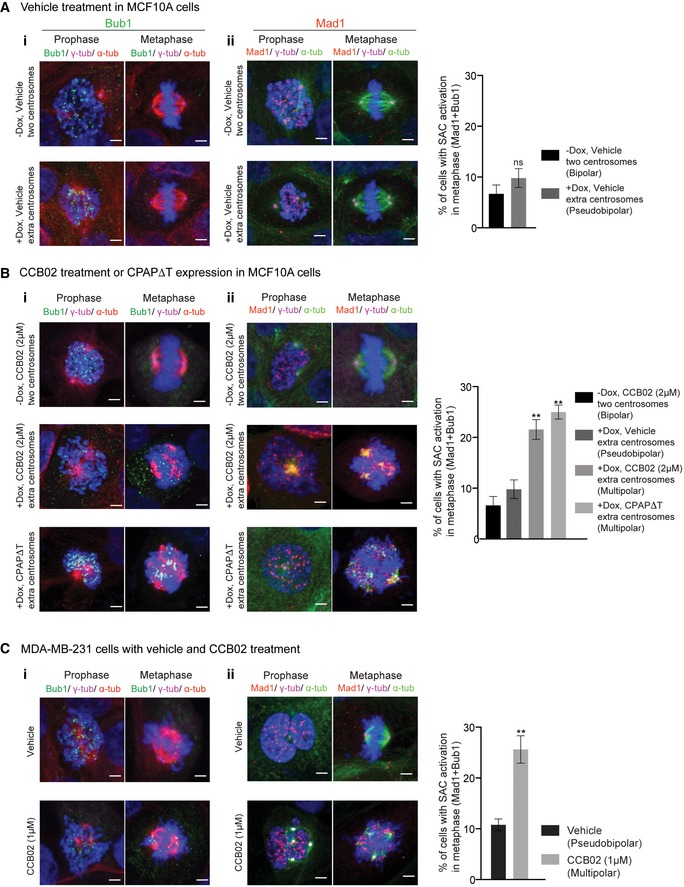
- Vehicle treatment. SAC components Bub1 (i, green) and Mad1 (ii, red) mostly accumulate in prophase but not in bipolar mitotic (two centrosomes‐containing) or pseudobipolar mitotic (extra centrosome containing) cells. MCF10A cells containing two centrosomes (−Dox, two centrosomes) and extra centrosome (+Dox, extra centrosomes) were used. Cells were stained for Bub1 (green) and Mad1 (red), γ‐tubulin (magenta), microtubules (α‐tubulin, red) and DNA (DAPI, blue). Scale bar, 2 μm. Bar diagram at right quantifies SAC activation only in metaphase cells (both bipolar and pseudobipolar). Data represent mean ± SEM of three independent experiments, (N) = 3 (n = 220 cells per condition). P‐values were obtained using one‐way ANOVA. **P < 0.001.
- CCB02 treatment or CPAPΔT overexpression. In contrast to bipolar metaphase cells (as observed above in panel A), Bub1 (i) and Mad1 (ii) proteins accumulated in multipolar metaphase cells where CPAP‐tubulin interaction is perturbed either by CCB02 treatment or CPAPΔT overexpression. MCF10A (−Dox, two centrosomes) and MCF10A (+Dox, extra centrosomes) cells were used. MCF10A cells (+Dox, extra centrosomes) expressing CPAPΔT were used as control where CPAP‐tubulin interaction is genetically perturbed. Bar diagram at right quantifies SAC activation only in metaphase cells (both bipolar and multipolar). Data represent mean ± SEM of three independent experiments (N) = 3 (n = 250 cell per condition). P‐values were obtained using one‐way ANOVA. **P < 0.001.
- SAC activation assay in MDA‐MB‐231 cells. Bar diagram at right quantifies SAC activation only in metaphase cells (both bipolar and multipolar). Data represent mean ± SEM of three independent experiments. (N) = 3 (n = 240 cells per condition). P‐values were obtained using one‐way ANOVA. **P < 0.001.