
Figure 5. Chemical inhibition of CPAP–tubulin interaction causes interphase centrosomes to recruit enhanced levels of PCM .
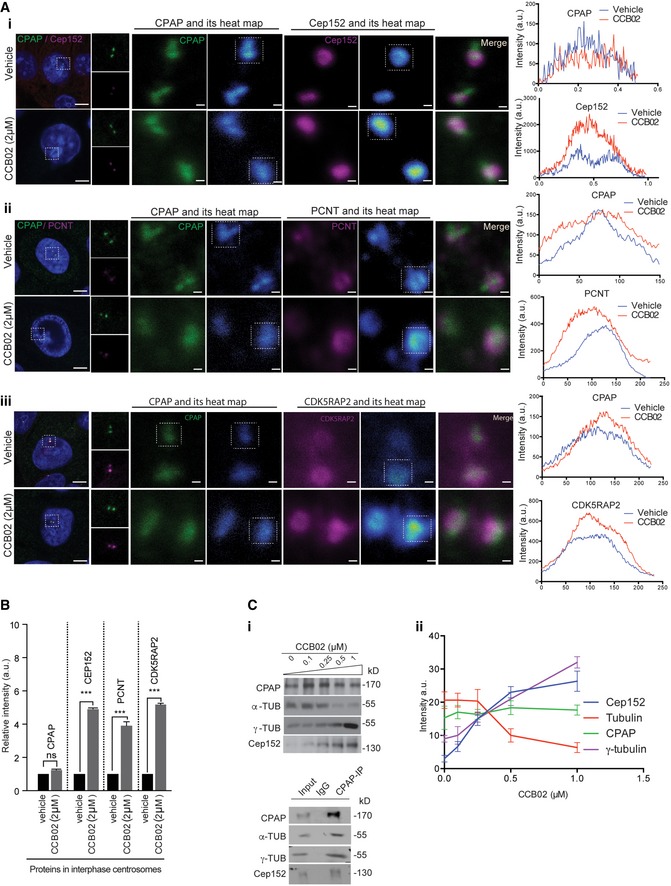
- Interphase centrosomes of CCB02‐treated two centrosomes‐containing MCF10A cells display an enhanced level of PCM proteins. CPAP (green) intensity remains same. Cells are stained for CPAP (green), PCM proteins (magenta) Cep152 (i), PCNT (ii) and CDK5RAP2 (iii), and microtubules (α‐tubulin, red). Scale bars, 2 μm for left panels and 0.2 μm for right panels. Heat map images show intensity saturation (blue) for CPAP, Cep152, PCNT, and CDK5RAP2 upon CCB02 treatment. Line graphs at right to each panel indicate the heat map intensity of single centrosomes of cells (given in boxes at heat map panels) treated with vehicle (blue line) or CCB02 (red line). Images were recorded with low laser excitation and high zoom factor.
- Bar graph quantifies relative intensity of CPAP‐interacting proteins in interphase centrosomes compared to vehicle treatment. At least 150 centrosomes (for vehicle) and 130 centrosomes (for CCB02) were analyzed in each condition. Error bars, mean ± SEM. (N) = 3. Ordinary two‐way ANOVA test ***P < 0.0001.
- Immunopurification of CPAP complexes from CCB02‐treated cell extracts. (i) CCB02 specifically prevents CPAP–tubulin interaction. This allows CPAP to bind an enhanced amount of Cep152 and γ‐tubulin. Control IP experiment is shown below. (ii) Plot showing PCM protein intensities co‐immunoprecipitated with CPAP at various concentrations of CCB02 treatment. CPAP amount does not change with CCB02 treatment. Data represent mean ± SEM. (N) = 3.