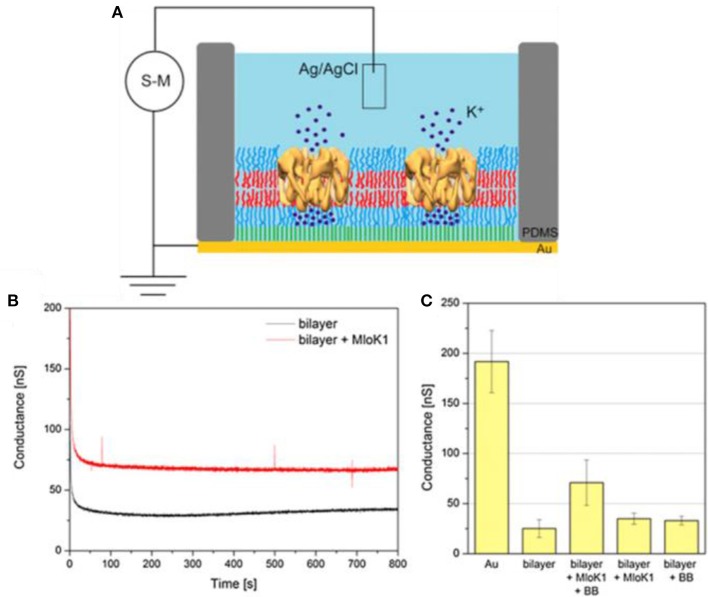
Figure 14.
(A) Schematic representation of the setup used for conductance measurements through polymer membranes (S-M – source-meter, PDMS – poly(2-methyl-2-oxazoline) stamp). (B) Time course for conductance of solid-supported polymer bilayer (black line) and solid-supported polymer bilayer with incorporated MloK1 (red line). (C) Conductance measured at a constant applied voltage of 40 mV (Au – gold substrate, BB – Bio-Beads). Reproduced from Kowal et al. (2014) with permission of Copyright © 2014 Elsevier Ltd.

