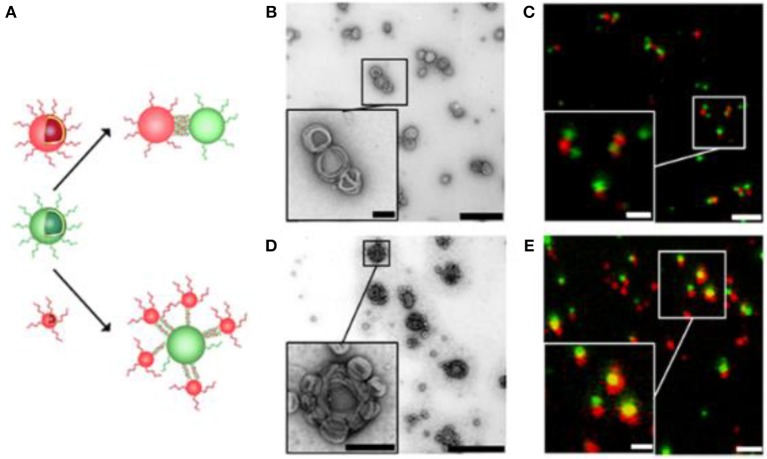
Figure 4.
Self-organization of complementary ssDNA-polymersomes. (A) Schematic representation of distinct spatial topology resulting from mixing differently sized complementary ssDNA-polymersomes. TEM and CLSM micrographs of chain-like (B,C) and satellite-like polymersome clusters (D,E). The scale bar for TEM micrographs is 1,000 and 200 nm in the inset; in CLSM micrographs it is 2 and 1 μm in the inset. Reproduced from Liu et al. (2016) with permission from Copyright (2016) American Chemical Society.

