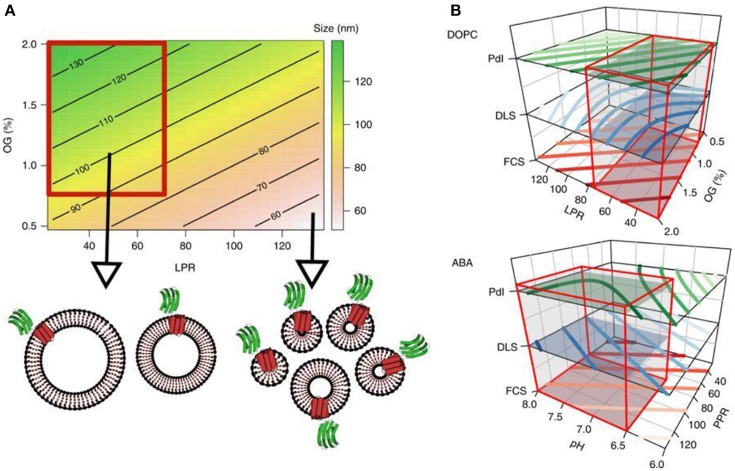
Figure 5.
Contour plots. (A) The contour plot visualizes the proteoliposome size, modeled from the first round of experiments depending on the LPR and OG concentration, whereas the pH value is fixed at 7. The color gradient indicates different sizes and shows a trend toward a region within the design space which yields homogeneous, large proteoliposomes (highlighted by the red box). (B) This region of interest applies to all three responses as shown in the stacked contour plots for both membrane types. Red boxes encompass the subregions of the design space which was subsequently screened for proteovesicles with functioning PR-GFP. Reproduced from Goers et al. (2018) with permission of https://creativecommons.org/licenses/by/4.0/.

