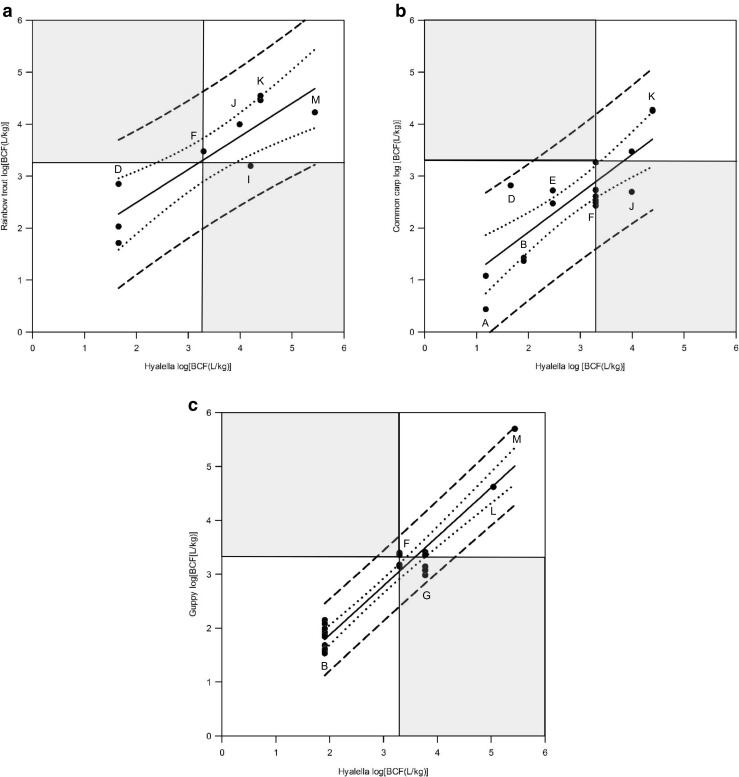
Fig. 5.

Comparison of kinetic BCFs estimated for male H. azteca and fish BCF estimates for rainbow trout (a), common carp (b), and guppy (c). Hyalella BCF values are normalized to 5% lipid content except for 14C pyrene (G). The thin black lines mark the regulatory threshold of log BCF 3.3 (BCF = 2000). Data points in the hatched area would relate to substances which highly accumulate in fish (log BCF ≥ 3.3) but not in H. azteca and vice versa representing type II error (upper left) and type I error (lower left), respectively. Black regression line with 95% confidence interval (dotted lines) and prediction interval (short dash). Test codes as defined in Fig. 4. For detailed results of linear regression see Electronic Supplementary Material Part 3
