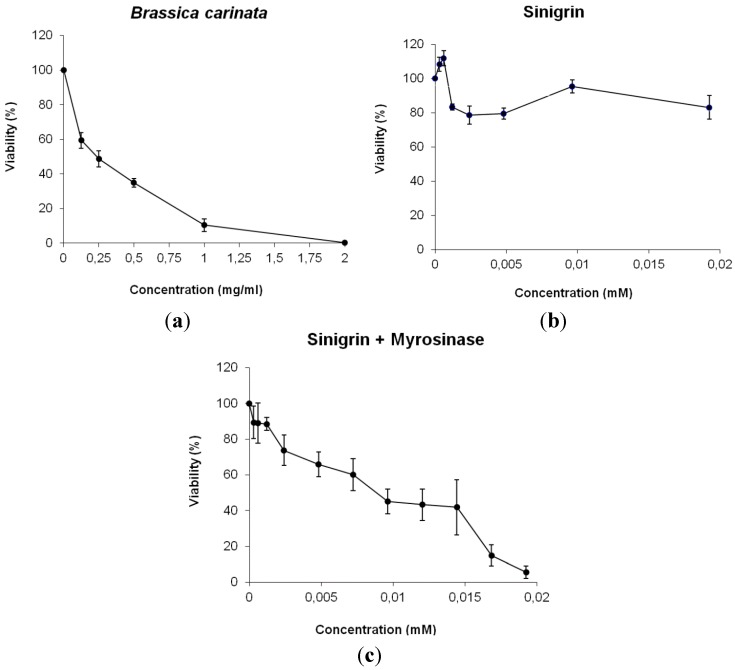
Figure 3.
Survival of HL60 cultures treated with different concentrations of: (a) B. carinata; (b) sinigrin; (c) sinigrin + myrosinase. Curves are plotted as percentages with respect to the control counted from at least three independent experiments (mean ± SD). Correspondence: 1 mM sinigrin = 397.46 µg·mL−1 sinigrin.

