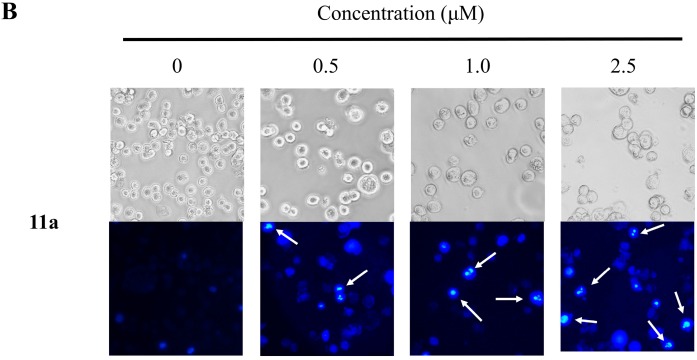
Figure 2.
The morphological changes of HT-29 cells treated with 0–2.5 μM plumbagin (1) (A) and 11a (B) for 48 h. (magnification, 200×). (A,B) The upper panels showed the cell morphology under phase-contrast microscopy, and the lower panels display the Hoechst 33258-stained nuclear patterns take by fluorescence microscopy (magnification, 200×).


