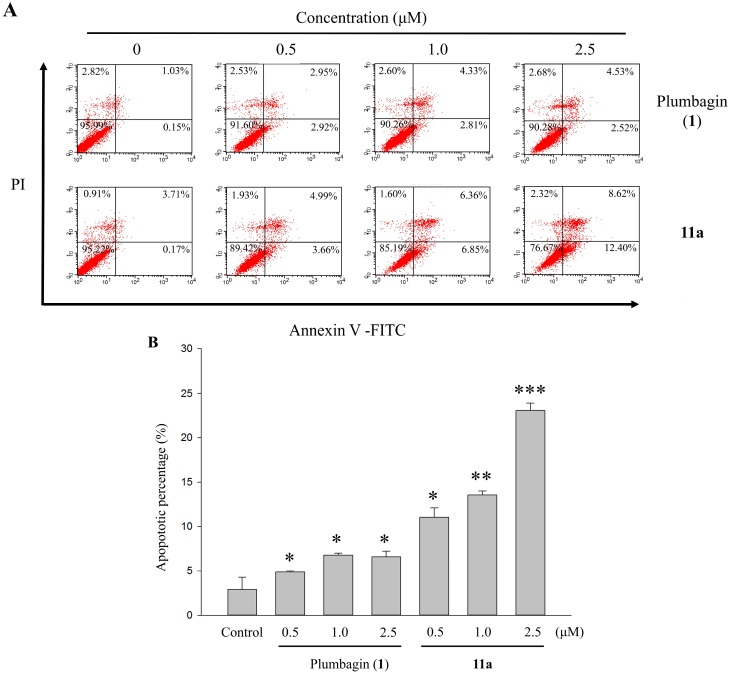
Figure 4.
(A) The effects of the 48 h treatments with 0–2.5 μM plumbagin (1) and 11a on apoptotic percentage distribution of HT-29 cells by Annexin V-FITC/PI staining. (B) The apoptosis rate was calculated by flow cytometry and cell apoptosis was defined in early and late apoptosis treatment with 0–2.5 μM plumbagin (1) and 11a for 48 h. Each value represents the mean ± SD of three independent experiments. * p < 0.05, ** p < 0.01 and *** p < 0.001 vs. control.

