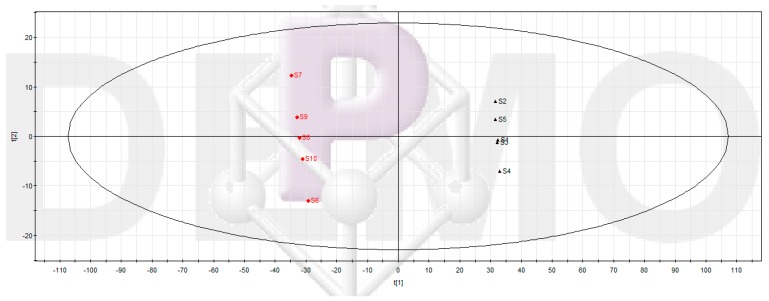
Figure 2.
Partial least squares discriminant analysis (PLS-DA) scores plot of Groups 2 and 3. The main composition of the second and the third group of samples could be considered as the composition of burdock leaf fraction before and after inhibiting Pseudomonas aeruginosa biofilm, respectively. Group 2 includes samples 1–5 (S1–S5) and Group 3 includes samples 6–10 (S6–S10). R2X = 0.77, R2Y = 0.99, Q2 = 0.99.

