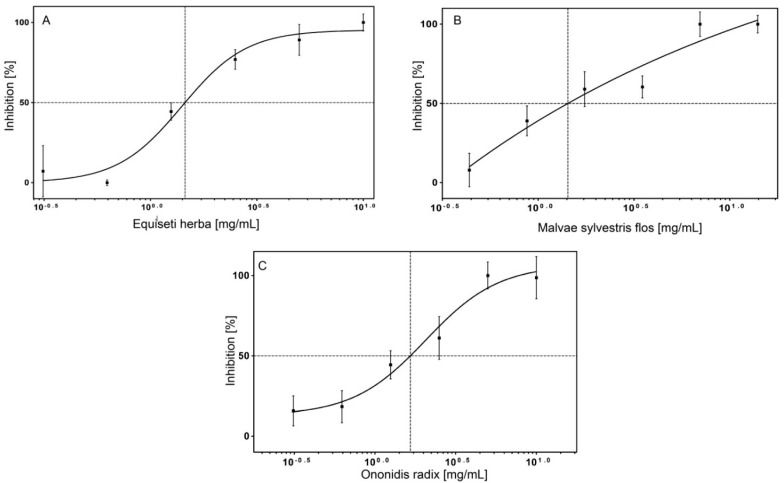
Figure 9.
IC50 values of different plant extracts on surface displayed Hyal-1. (A) Equiseti herba; (B) Malvae sylvestris flos; (C) Ononidis radix. Activity of surface displayed Hyal-1 was measured after incubation with extract of each plant at concentrations ranging from 0 to 10 mg/mL. The IC50 value was calculated from the inflection point (50% inhibition of the Hyal-1 activity) of the plot. The different shape of the curves probably results from the heterogeneous composition of the extracts and from the different solubility of the constituents in the extracts (n = 3, error bars ± SD).

