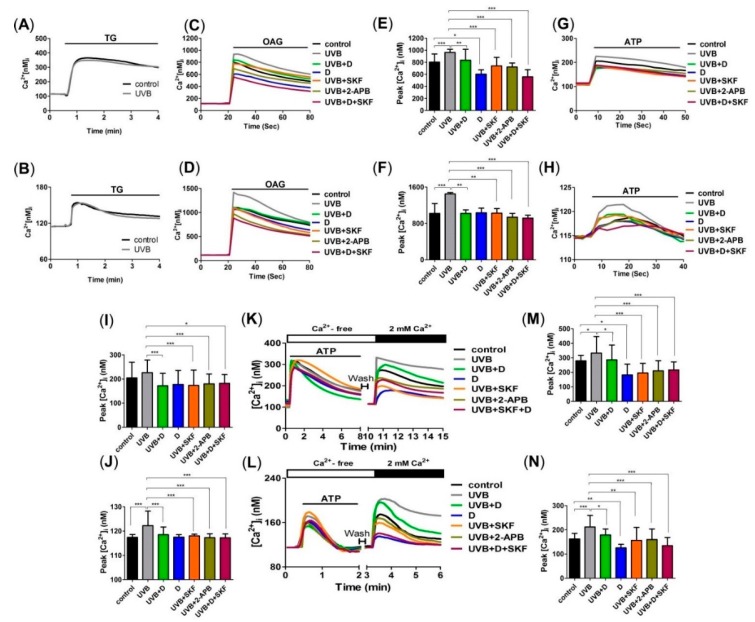
Figure 3.
Derinat reduced UVB activated Ca2+ signaling in skin cells. Ca2+ imaging analysis of the thapsigargin (TG)-induced Ca2+ response after the application of 20 nM TG (small black bars) in (A) and KCs and 100 nM TG in (B) HDF (n = 3). After 30 min of pretreatment with Derinat (D), SKF96365 (SKF, 20 μM in KCs and 50 μM in HDF), 2-aminoethoxydiphenyl borate (2-APB, 50 μM in KCs and 100 μM in HDF) and SKF + D; OAG at 100 μM and 200 μM was applied to (C) KCs and (D) HDF, respectively, to stimulate the Ca2+ responses of TRPCs after 30 min of UVB exposure (n = 3). (E,F), quantification of the peak of the intracellular Ca2+ responses shown in (C) and (D) (*, p < 0.05; **, p < 0.01; ***, p < 0.001). Ca2+ imaging analysis of the adenosine triphosphate (ATP)-induced Ca2+ response. The application of 100 μM ATP (small black bars) in (G) KCs and 200 μM ATP in (H) HDF (n = 3). (I,J), quantification of the peak of the intracellular Ca2+ responses shown in (G,H) (*, p < 0.05; ***, p < 0.001). CaCl2 was extracellularly applied (large black bar) to increase Ca2+ from 0 to 2 mM and open the TRPCs after the application of ATP (small black bars) in (K) KCs and in (L) HDF in Ca2+-free BSS solution (open bar) (n = 3). (M,N) quantification of the peak of the intracellular Ca2+ responses shown in (K,L) after applying CaCl2 (*, p < 0.05; **, p < 0.01; ***, p < 0.001). The Ca2+ signals represent the mean value of 20 cells.

