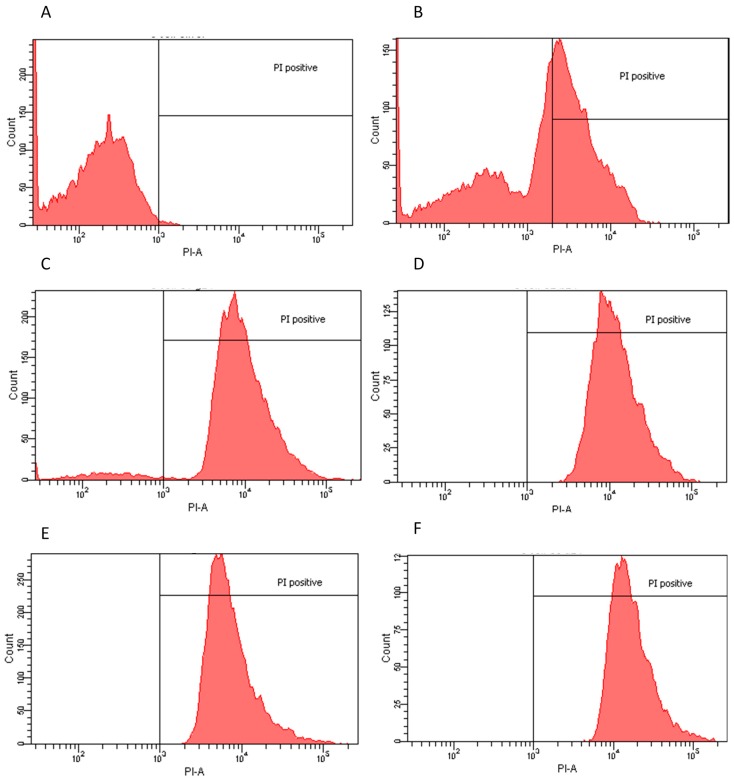
Figure 2.
Flow cytometry histograms derived from scatter plots showing fluorescence of live (<103) or dead (>103) E. coli stained with propidium iodine (PI) post 24 h incubation with controls or extracts. X-axis corresponds to the PI positive marked microorganisms and Y-axis to the total cell count. (A) E. coli sample PI negative control, 96.7% viability; (B) E. coli incubated for 30 min with 70% ethanol PI positive control, 48% viability; (C) water dry leaf non-boiled extract 4 μg/mL, 5.7% viability; (D) water non-dried leaves non-boiled, 1.5 μg/mL 0.1% viability; (E) ethanol 4 μg/mL, 0.1% viability; and (F) ethyl Acetate 1 μg/mL, 0.3% viability.

