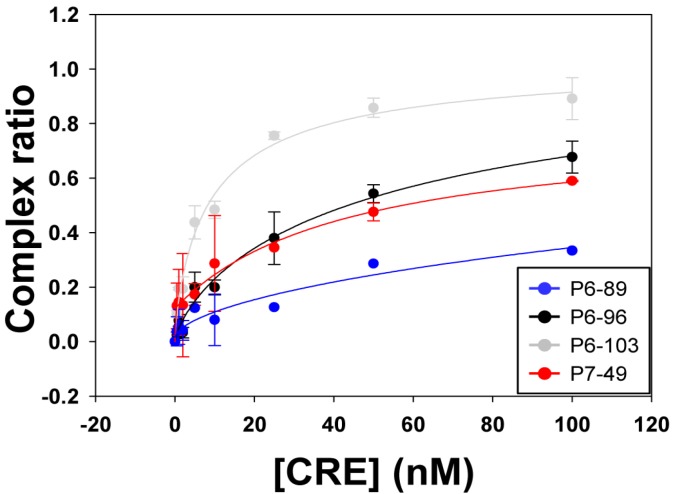
Figure 4.
Binding assays of the aptamers P6-86, P6-96, P6-103, and P7-49 to the HCV CRE region. Graph shows the titration curve corresponding to the binding assays performed with the different aptamers under study. Internally 32P-labeled transcripts encompassing each of the tested aptamers were challenged with increasing amounts of their unlabeled interacting partner HCV-CRE194. Experiments were repeated at least three times and data were fitted to a non-linear equation for the calculation of the Kd value.

