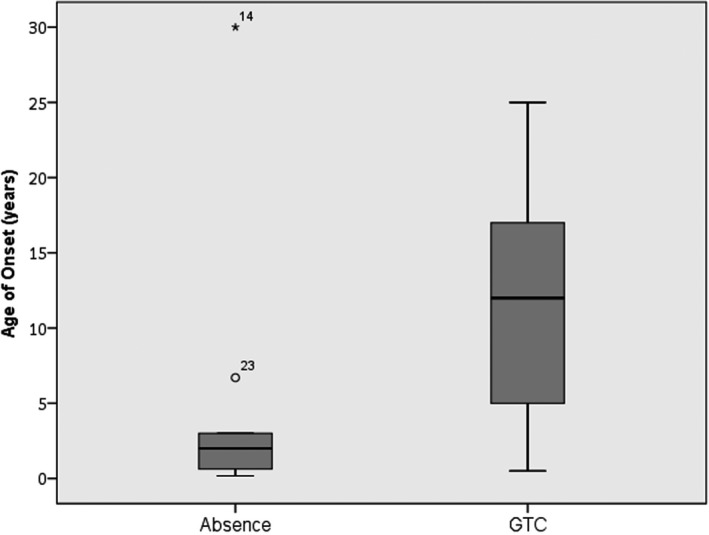
Figure 2.

Box plot of age of onset versus seizure type in SSADH deficiency. Box plot of age of onset for type of seizures. The median age of onset is indicated by the solid black line inside the box (absence = 2 years old, GTC = 12 years old). The box signifies the 1st quartile (Q1) and the 3rd quartile (Q3). The vertical lines (whiskers) indicate the minimum and maximum values (range). Data falling well outside the Q1 and Q3 range are plotted as outliers of the data; the circle and asterisk indicate outliers. The circle represents an age of onset of absence seizures at 6.7 years, which is outside the Q3 value but still within age group <12 years. The asterisk represents an age of onset of absence seizures at 30 years old, which was reported during an EEG.
