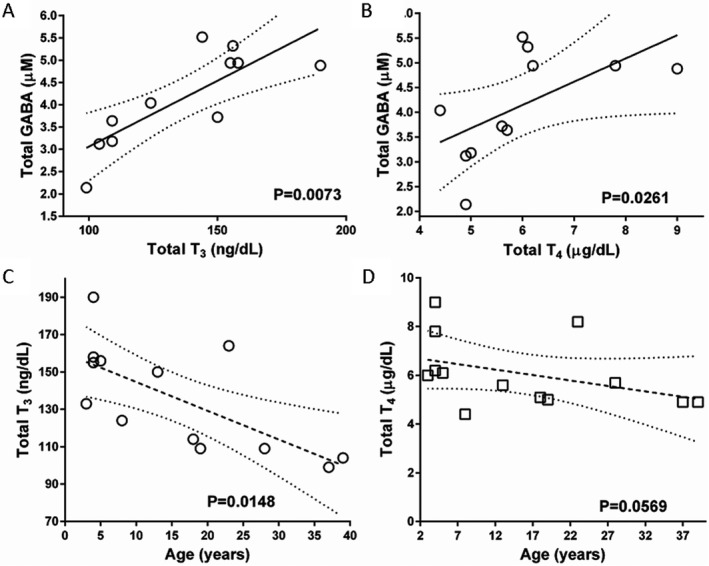
Figure 3.

Correlations between thyroid hormones and total GABA in patient plasma (A and B) and thyroid hormones as a function of patient age (C and D). Dotted lines indicate 95th percentile. Confidence intervals (statistical analysis, Spearman correlation). Samples were derived from an archival collection of SSADH‐deficient plasma samples maintained at −80°C.
