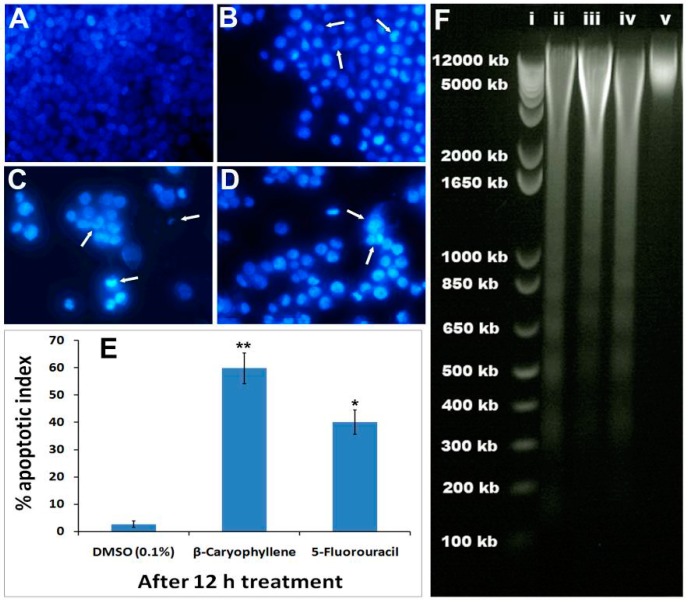
Figure 6.
Photomicrographs depicting images of HCT 116 cells with Hoechst 33258 staining (A) Cells treated with vehicle (0.1% DMSO). The vehicle-treated cells revealed an intact cell membrane with an evenly distributed nucleus in cytosol; (B) Cells after 6 h of β-caryophyllene (10 µM) treatment. Cells treated with β-caryophyllene displayed early stage apoptotic symptoms such as membrane blebbing and chromatin condensation (arrows); (C) Cells after 12 h of β-caryophyllene (10 µM) treatment. The arrows indicate the advanced staged apoptotic signs such as of nuclear dissolution including the half-moon (crescent) shaped apoptotic nuclei. In addition, at several places, the arrows mark chromatin breakdown and fragmentation; (D) Cells treated with standard reference, 5-flourouracil (10 µM) also exhibited significant induction of apoptosis in the cells; (E) Graphical representation of percentage of apoptotic indices for HCT 116 and PANC-1 cells. The apoptotic index for each test group was expressed as a percentage of the ratio of number of apoptotic cells to the total number of cell in 10 different microscopic fields. Values are presented as mean ± SD (n = 10), * represents p < 0.05 and ** represents p < 0.01; (F) Effect of β-caryophyllene (10 µM) on DNA fragmentation in HCT 116 cells after 24 h treatment. (i). The standard DNA ladder; (ii). The DNA fragmentation pattern of HCT 116 cells treated with 5-flourouracil (10 µM); (iii). DNA fragmentation pattern of HCT 116 cells treated with β-caryophyllene (5 µM); (iv). DNA fragmentation pattern of HCT 116 cells treated with β-caryophyllene (10 µM); (v). DNA fragmentation pattern of HCT 116 cells treated with 0.1% DMSO (negative control).

