
Figure 1.
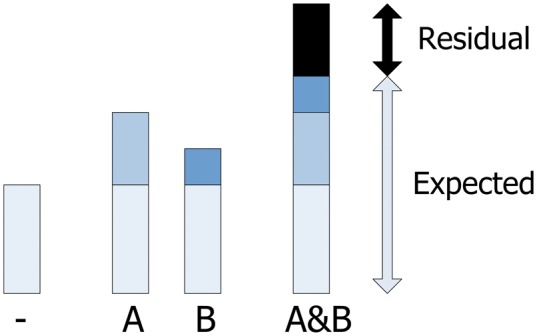
Schematic overview of an interaction between two conditions A and B relative to an additive baseine model. The bars correspond to the frequency of the event of interest (1) in the absence of both A and B, (2) with A but not B, (3) with B but not A, and (4) with A and B together. The shades correspond to: the marginal relative frequency of the event (lightest), the increased frequency attributable to A, the increased frequency attributable to B, and the increased frequency attributable to an interaction between A and B (darkest).