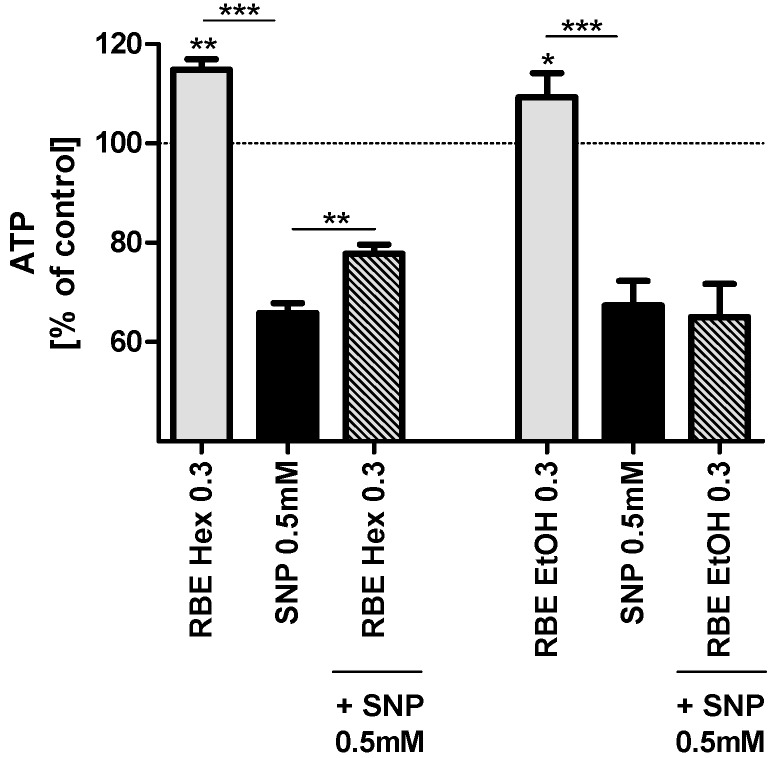
Figure 2.
ATP concentrations of PC12 cells after 24-h incubation with 0.3 mg/mL hexanic (RBE Hex) or ethanolic (RBE EtOH) rice bran extract (RBE, grey bars); ATP concentrations after insult with sodium nitroprusside (SNP, 0.5 mM) for 6 h (black bars) and ATP concentrations after preincubation of PC12 cells with ethanolic or hexanic RBE for 1 h and insult with SNP (0.5 mM) for 6 h (striped bars); cells treated with cell culture medium served as control for normalization (100%); there were no differences in ATP between medium treated and DMSO or ethanol treated cells (data not shown); n = 6–7; mean ± SEM; ANOVA with Tukey’s post-test; * p < 0.05; ** p < 0.01; *** p < 0.001.

