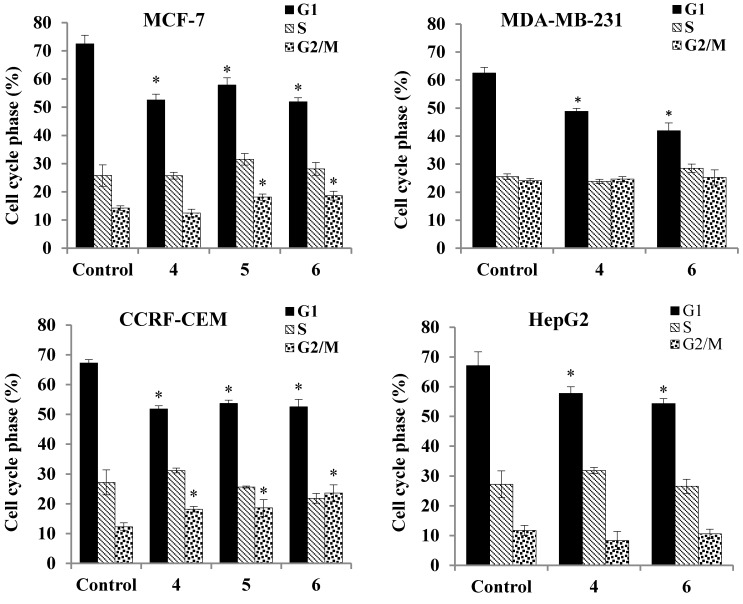
Figure 8.
Cell cycle distribution of human cancer cells treated with compounds 4, 5 and 6. The cells were incubated with a IC50 concentration of the compounds for 24 h and then analyzed cytometrically. The results represent mean ± SEM of the data from three to four individual experiments, each done at least in sextuplicate. * p < 0.05 vs. control.

